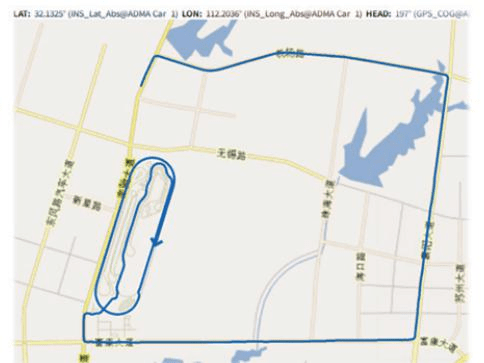
Traditional cars, as an indispensable part of our daily life, pursue continuous progress in their performance. Therefore, performance tests have been carried out continuously since the birth of automobiles. The cycle test on the test bench, including fuel economy and analysis of the NEDC (New European Driving Cycle) standard based on the emission level of the vehicle engine system, began in the 1980s (the last modification was in 1997).
However, the results under actual conditions are different from those on the test bench. This is a frequent behavior. In addition, it is also common in other driving cycle tests, such as 10-15 mode in Japan or FTP72 and FTP75 mode in the United States.
In order to overcome these challenges and approach realistic driving conditions, we have developed a new standard - WLTP (Worldwide Harmonized Light Vehicle Test Program). This standard represents a more realistic procedure for evaluating traditional vehicles and future electric vehicles, such as hybrid electric vehicles, BEVs, PHEVs and FCEVs. WLTP standards are more dynamic and produce better results based on road performance.
The main differences between NEDC and WLTP standards are as follows :
>Each cycle lasts for 30 min
>The distance is longer, 23.3 km instead of 11 km
>The faster speed is 131 km/h instead of 120 km/h, and the average speed is between 34 km/h and 46 km/h
>Cold start
>High acceleration and deceleration during driving
In addition, based on the real driving values, the changes from the conditions of Zone 2 (urban and expressway) to Zone 4 (low, medium, high and superelevation) make the results more realistic and comparable. Road testing under actual conditions is the best and certainly the most realistic test method. Therefore, the evaluation of these tests in the development process becomes more important, aiming to improve efficiency and reduce costs. Road testing brings comprehensive advantages, including all parameters of battery management and automatic driving, as well as interaction of different tasks.
The comparison test of power consumption shows the difference between the two standards mentioned above, as well as the test on the real road. Compare the values from the manufacturer's data sheet (NEDC) with the values from the test bench (WLTP) and road tests. The comparison is as follows
The hybrid dynamics, BEV, PHEV and FCEV evaluation tests require high-precision measurements of all electrical and mechanical parameters. In addition, communication interfaces (for example, CAN/CAN-FD and automotive Ethernet are usually required), combined with precise IMU (inertial measurement unit) and DGPS (differential global positioning system). A processor unit with a Kalman filter is also used to evaluate inertial sensors and GPS signals. The following figure gives an overview of some test parameters.
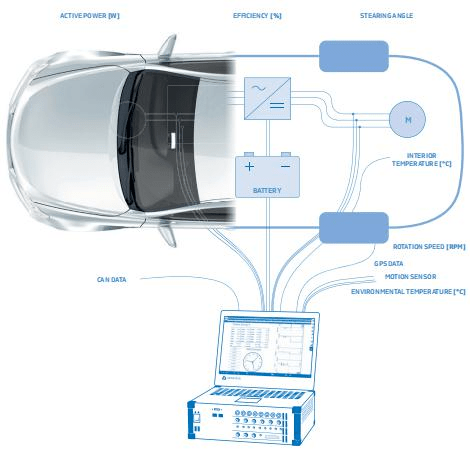
Challenges faced by electric vehicle testing
1. In order to obtain the best accuracy of the test including power and energy, the measuring equipment shall not be provided by the vehicle itself, so as to avoid affecting the measured value and causing distortion of the results. Therefore, the measuring system must be equipped with an internal battery of minimum weight.
2. In order to ensure the synchronization of data and correct time stamp, all data should be recorded in one system. Otherwise, the synchronization of each system should be considered. Having all the data on one system also has an additional advantage of less post-processing, so there is less risk of human error.
3. In order to complete all required measurement tasks, a suitable measurement system is required, including different inputs of analog signals. Each application requires other types of settings and sampling rates. Therefore, the measurement system should have a high count measurement channel and a single sampling rate to meet the required resolution of each channel.
4. The development process of the new automobile electric drive system is a key link, which requires a lot of data interpretation and evaluation. In order to meet this need, it is necessary to record the high sampling input without gaps. The original record has a high sampling rate and the data stored on the ssd at each sampling point is the basis for further testing, which helps to avoid repeated measurement of missing parameters.
5. Inverter and motor are the two most important elements. When it comes to the application of test bench and road, because all the power measurement parameters calculated by software are based on the previous frequency detection, accurate frequency detection and filter time correction are the key factors. Generally, the power analyzer or measurement system with manual cut-off filter cannot guarantee the accurate frequency of this dynamic process. The compensation of filter delay (including cut-off filter and anti aliasing filter of zero crossing algorithm) must be combined with mechanical parameters to obtain significant synchronization results.
6. Due to the fast acceleration and deceleration of the measurement system, its ability to quickly calculate the periodic value is crucial to ensure the accuracy. A constant "update rate" means that the calculation of time windows with more cycles cannot provide sufficient accuracy for such a highly dynamic process.
7. For most measurement data, the integrity of the recorded data is directly related to the sensor used. In addition to incorrect measurement settings, the inaccuracy caused by sensors has a great impact on the measurement chain. This effect will be aggravated by changes in temperature and sensor position, but the signal will also be aggravated by rapid changes. A key component of efficiency analysis is current data. The most advanced sensor based on zero flux principle is recommended for power measurement to avoid large phase shift, error amplitude in AC measurement, and high offset caused by DC measurement of high-voltage battery.
8. High sampling rate has great advantages in the development and analysis of inverter. The visualization and gapless recording of the overvoltage peak value of the pulse width modulation (PWM) signal are essential for improving the insulation and efficiency or conducting higher frequency testing. The system needs a powerful internal bus and hundreds of MB/s data transmission with high CPU power and high-end tasks of the most advanced measurement and analysis software.
Typical Measurement Configuration for Electric Vehicle Testing
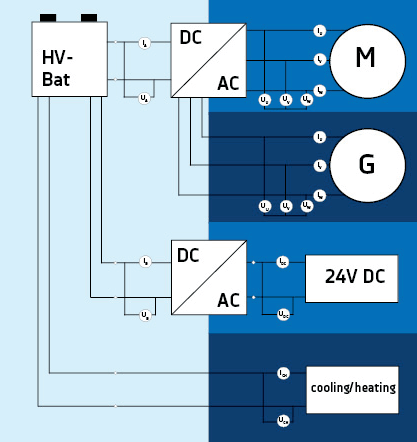
The core elements of most electric vehicle tests are the electrical power train, mechanical parameters and IMU, including GPS and vehicle BUS parameters. The number of channels of the electrical part to be measured depends on the number of phases of the motor( E.g. 6-phase permanent magnet synchronous motor). Figure 3 is an example of an electrical drive train and the number of its channels. Below Shows a measurement system with IMU and GPS.
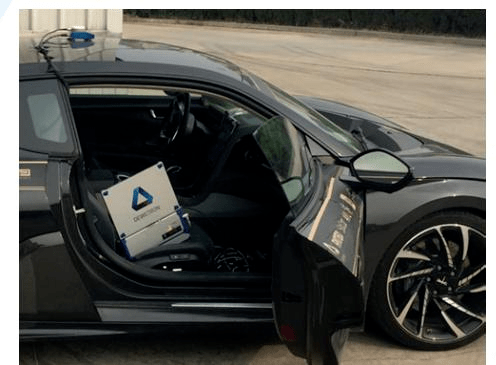
The measurement system used in this example is a battery based DAQ data acquisition measurement system DEWE3-A4 To meet all the requirements mentioned in the "Challenges" section. The measurement system is used in combination with ADMA-IMU as an established vehicle system. Dewei Oxygen is used as data acquisition and analysis software.
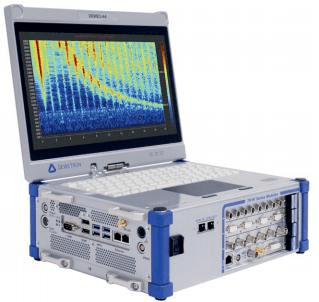
The DEWE3-A4 in this example is compact in design and very suitable for road survey. For applications on the test workbench, you usually use DEWE3-PA8 Such fixed system.
Visualization of measurement data
Visualization and reporting play another important role in explaining the meaning of data. Post processing is not only an important part, but also checking the rationality of measurement data during testing can save time and avoid use problems
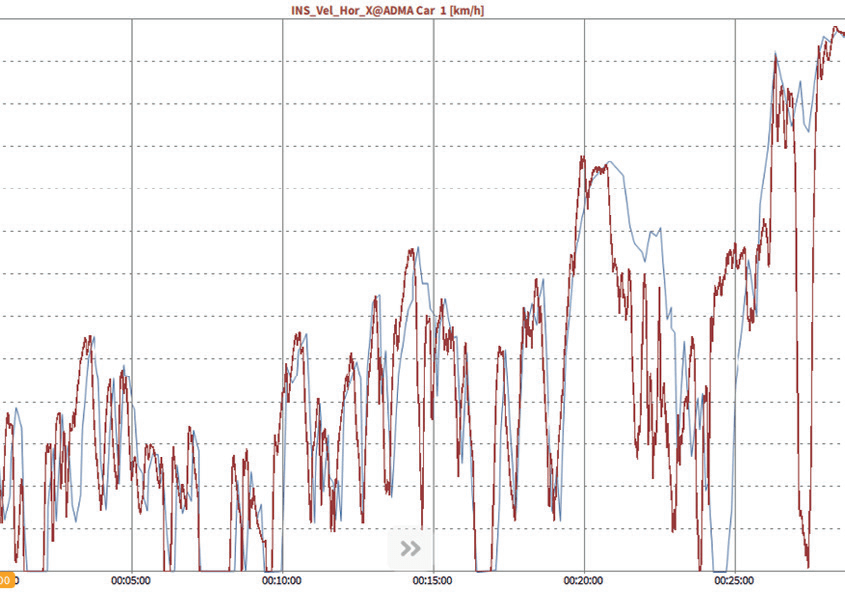
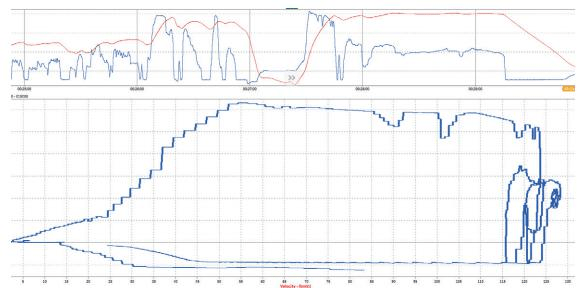
The figure above shows the actual speed of the vehicle in the background using the standard wltp cycle as a comparison test during. The figure below shows two different instruments: speed and battery power in the time dependent recorder and speed
In the xy diagram, the direct relationship is shown
The last important factor is that in addition to analog and bus data, other data are needed to get important results in the post-processing process. For comparison and further testing, accurate Location tracking and weather conditions Is a prerequisite.
