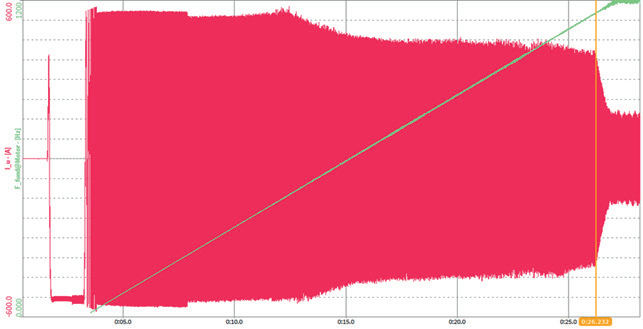
For many years, the power measurement and analysis of AC voltage and current has been considered as a fixed subject. Due to the application of variable frequency drive and the recognition of automotive electric drive technology, this has undergone fundamental changes in the past few years. Today, it is also important to collect and verify the dynamic characteristics of the drive, because many systems rarely have a fixed working point for a long time during the measurement, but rather are quite dynamic. However, the "traditional" and "available power analyzers in the market are mainly designed for fixed applications. DEWETRON has developed a power analyzer that can meet the flexible needs of customers and prepare for future market demands. With the increasing proportion of inverter fed drivers, it is possible to reduce the number of measurement ranges, because the range for high peak measurement is used more frequently even at low power levels.

Daily and routine solutions
In today's world, in order to meet the test and analysis needs of customers, the power transmission system should be tested and evaluated in the real environment with high dynamic load curve. Traditionally, power testing, measurement and analysis are expensive and time-consuming. With the improvement of power analysis technology, the complete solution meets the demand with high efficiency and economy. In addition, valuable testing time can be limited to develop more time-saving and cost-effective solutions.
Outdated analyzers cannot provide reliable data for decision criteria
>There is no independent use of voltage and current input; Alternative and low common mode wiring cannot be used.
>Complex analog circuits (large and heavy) are not very flexible for future needs.
>An additional analog signal path is required for frequency detection.
>The user must set the filter cut-off frequency before measurement; It can be very challenging to analyze in one test at low speed and high speed respectively.
>Since the entire waveform data cannot be captured, the engineer must use other recording equipment (oscilloscope recorder) to analyze the waveform after the test is completed.
>Since the calculation window size is fixed during measurement, a compromise between resolution and dynamic range should always be considered.
>Due to the gap in the boundary area of the calculation window, there is a blind spot in the power data.
DEWETRON Solution
> DEWE3-PA8 install OXYGEN Software
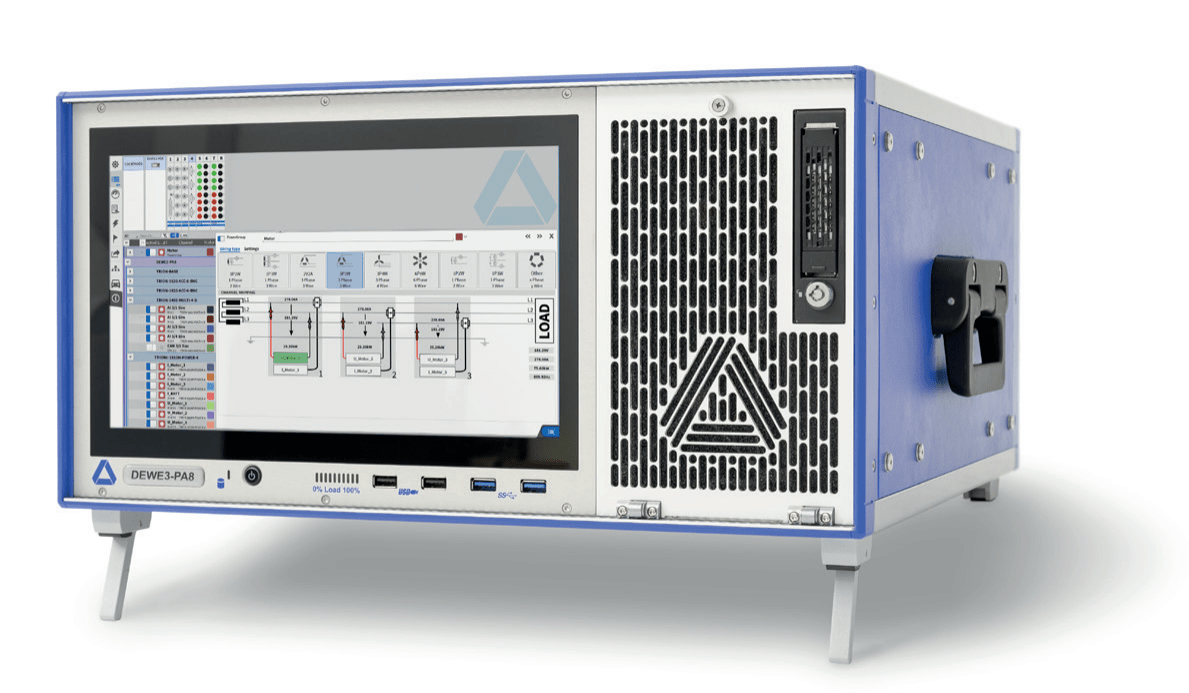
> TRION3-1810M-POWER -4 Modules
> TRION-Base modular
>PA-IT or PA-IN series current sensor
HDR (high dynamic range) input, that is, accurate measurement of voltage from 0V-2000V and current from 0-2000A can enable users to analyze the dynamic drive system. Full spectrum power analysis can be realized from the start of load jump and moving start and braking. Our power analyzer combined with DEWETRON's own OXYGEN measurement software makes power analysis simple and intuitive. The power analysis function of OXYGEN software integrates the frequency detection algorithm, which can meet all the requirements of modern power analysis. This feature is key to achieving accurate, reliable and stable readings, even in adverse circumstances. DEWETRON Continuously analyze each zero crossing point and each fundamental cycle. Our mission is to analyze signals seamlessly to present the truth of the whole process.
>Multi channel high density input module
>One routing signal path is directly connected to the 18 bit A/D conversion module
>Fully independent and flexible current and voltage input
>Set signal filter on FPGA, and continuous data flow to internal RAM and CPU
>All depth operations can be performed in DEWETRON's In OXYGEN software Complete
>Each power group can freely select its synchronous signal source to realize the detection of fundamental frequency (described in detail in the next paragraph)>each group of power values (power, voltage/current effective value and fundamental wave) can be calculated in each signal cycle (the calculation interval is as low as 1 ms)
Frequency detection innovation
DEWETRON's intention is to develop a solution with automatic tuning function, which is easy to use and solves all the weaknesses of previous solutions. We collect and analyze information from customers, and integrate all customer needs into the development process to successfully develop frequency detection solutions. At present, the solution has been developed for your use.
>The detection frequency is 0.2 Hz (<1 MS/s sampling rate )
>Adaptive filter with delay compensation function can suppress noise
>Adaptive zero crossing detector threshold avoids multiple bounces
>Sub sample precision due to interpolation
>Continuous operation, no clearance
Below, you can see some examples.
Its purpose is to visualize some functions of DEWETRON measurement software OXYGEN:
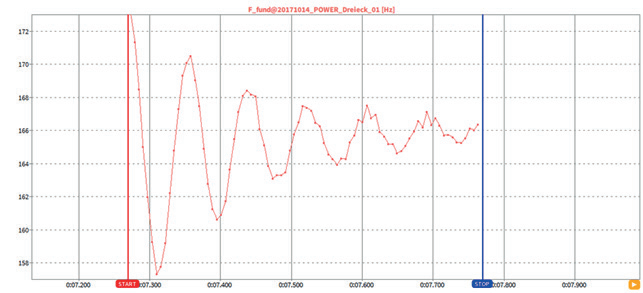
1. Analyze the vibration in the speed regulation control process with high resolution
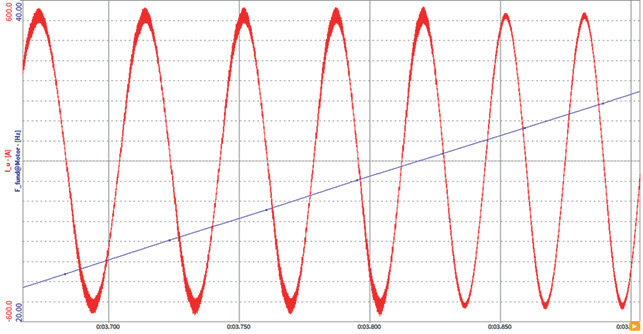
2. Reliable frequency detection, even if the noise ratio is high
3. Full range analysis of equipment can be realized with a single measurement
Example 1: Using high resolution to analyze the vibration of speed regulation process
Example 2: Reliable frequency detection, even if the proportion of noise is high
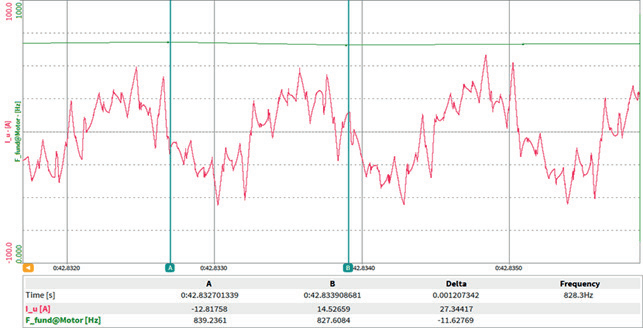
Figure 3: Full range analysis of equipment can be realized by a single measurement
