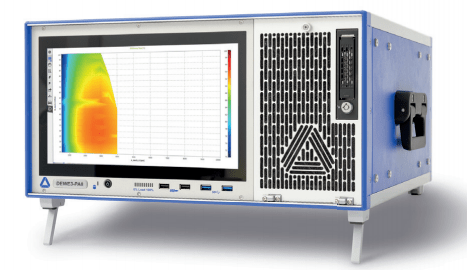
Efficiency distribution map MAP of motor and other power transmission systems
In the test of the power transmission system, the efficiency analysis of the components of the power transmission system plays a vital role, which is of great significance to the overall efficiency analysis of the power transmission system. The efficiency map MAP is a convenient solution that can be used in DEWETRON Measurement and analysis software of OXYGEN Direct and accurate visualization of the efficiency of the drive system in. It shows the relationship between the speed and torque of the x and y axes and the mechanical efficiency of the z axis. Efficiency is displayed in a color coded map with several areas for different values.

This diagram gives a good overview of the whole measurement range and all load steps, and is used to analyze the efficiency of any combination of speed and torque compared with individual values at different measurement points. Therefore, it can be used to design components to make the general work area efficient. Another advantage is that wrong measurement points can be corrected in the same measurement process. This can be achieved by simply overwriting a specific value in the map without losing other measured points. In addition, different trigger options can be used for different operation modes, such as Test bench Control or manual use. This article explains that In OXYGEN software Create an efficiency chart and the benefits of using this feature.
Input signal
DEWETRON The mixed signal power analyzer is the future solution for any power application.
The mixed signal input is to capture the voltage and current signals, as well as all relevant mechanical and environmental parameter instruments, to obtain a complete image of the DUT. Time synchronization measurement of mechanical efficiency and power value is the key factor to obtain significant results.
All power values are calculated for each cycle to correctly calculate all further parameters. For mechanical efficiency, speed and torque signals as well as voltage and current signals required for power measurement are necessary. With these parameters, the foundation of efficiency chart is established.
Create a power group
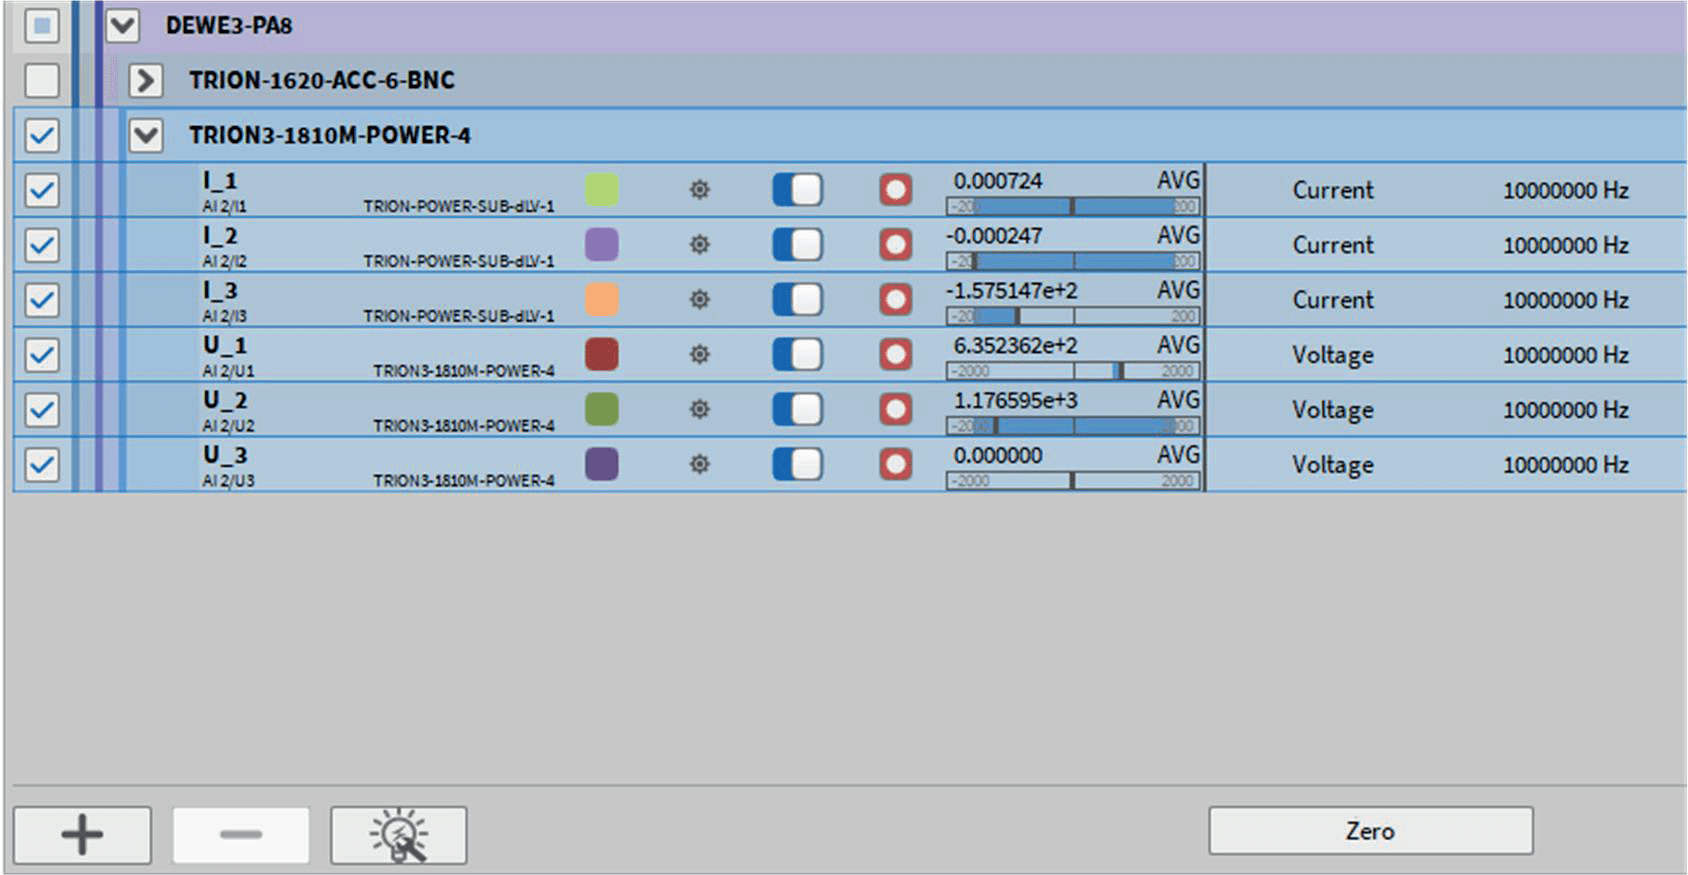
In order to calculate power parameters, a so-called power group can be created in OXYGEN software.
Select the voltage and current channels of each phase in this order, and then click the bulb button in the lower left corner. Power Group will appear as a new part in the channel list. When you expand this section, you can see all the calculation parameters. For example, these include the total root mean square (including harmonic frequency) value of each phase and all phase combinations of voltage, the basic root mean square (only basic frequency) value of each phase and all phase combinations, the average value and peak to peak value of each phase. In addition, many parameters of current, active, reactive and apparent power include power factor and energy value.

Through these simple steps, power measurement can be carried out 。
Mechanical power analysis can be enabled in Advanced settings>mechanical and can be opened by clicking the pinion button in the power group channel. There, speed (which must be in [rpm] or [U/min]) and torque (which must be in [Nm]) can be assigned to the mechanical power analysis.
The advantage of this is that the power and mechanical channels are synchronized, and no more settings are required. The time period for calculating the mechanical power is the same as the time period for calculating the electric power value, so it will be updated in each period.
Create an efficiency distribution map MAP
After completing these steps, simply click the "Add Efficiency Map" button in the mechanical power setting to create an efficiency distribution map.
Just like Power Group, a new section called Matrix Sampler Channel appears in the channel list. The reason for this name is that not only speed, torque and mechanical efficiency can be used as input channels, but also other channels can be used in this feature to visualize the dependence of an arbitrary input signal on two freely defined reference channels. However, if the efficiency map is created directly outside the power group, the following channels will automatically be used as input channels:
>X axis speed
>Y-axis moment
>Z-axis mechanical efficiency
This new data channel includes various settings, such as the customizable average window of input channel Z. The settings also include a preview of the result map, which contains values and steps. Another advantage is that different operation modes can be used. This feature can be used in the controlled environment of the test bench by defining trigger channels. Therefore, whenever the trigger is activated, the mapping will be updated. For example, this trigger can be a digital signal provided by the test bench. Otherwise, the steady-state trigger can be used for semi-automatic operation. Steady state operation does not require the selection of any trigger channel. Two conditions can be defined for input channels X and Y to arm the trigger. These two conditions are a threshold and time - a threshold must be kept within a certain time to activate the trigger, so a value is put into the map.
The other option is manual operation.
This is useful if a measurement is performed and a specific measurement point must be repeated due to any circumstances. For this manual operation, the trigger must be released to suppress the update of the map, and no values are stored in the matrix. Then, the specific measurement point can be approached, and the sample can be manually put into the matrix by clicking the Take sample button. Measurement errors can be corrected in a very simple way.
visualization
By dragging and dropping the matrix sampler channel onto the measurement screen, you can simply use the intensity map in OXYGEN to visualize the efficiency distribution map.
In the process of measurement, the map will be filled, giving a direct impression of efficiency. Linear interpolation can be selected, just like different level grading options. The figure below shows how the mapping is populated during measurement, which allows direct conclusions or an overview of the overall efficiency measurement range.

summary
The efficiency distribution map accurately shows the relationship between mechanical efficiency and speed and torque with color coded maps, which is helpful to analyze and describe the efficiency of motor drive system within the determined operating point range. You can quickly draw conclusions from the graph because it is filled online during the measurement. Multiple trigger options allow different modes of operation, making it a perfect feature for multiple application metrics.


