DVC power analyzer is used for full recording of power grid data
Release time: 22-11-21 19:12 Number of views: sixty-six
Application case of power grid feeder data recording
Chemical industry some World famous enterprises The customer's equipment is connected to the public grid, and they want to monitor the entire grid with all 48 feeders. All test data is stored in a database. The real-time values of voltage, current, active and reactive power, and energy consumption of each feeder shall be provided in the control room, and shall be visualized in its graphics. The transient shall be automatically printed and stored on the network drive. They also hope to make power quality report within a definable time period according to EN50160.
Challenges and requirements
• 48 feeders
• DVC power analyzer Connection between device and power control center
• Data and transient transmission of 48 power modules
• Different security levels, Linux and Windows operating systems
• For all dewetron Universal cluster server of cell
• Automatic transient reporting
Software:

• OXYGEN Software
• SCADA-104 protocol
• Software modules for power quality assessment and transient assessment
Hardware:

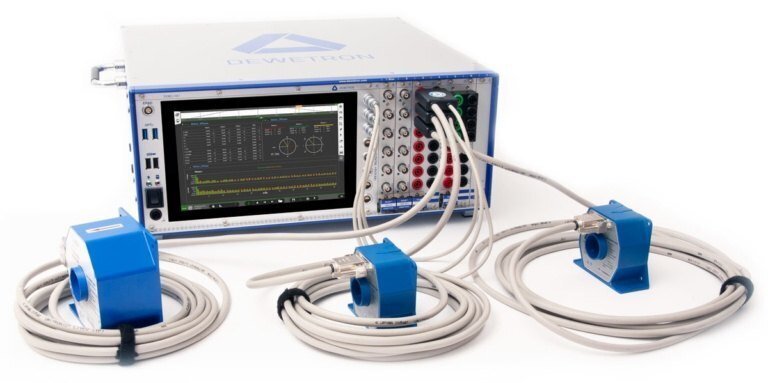
3 online DEWE3-PA8 Power analyzer
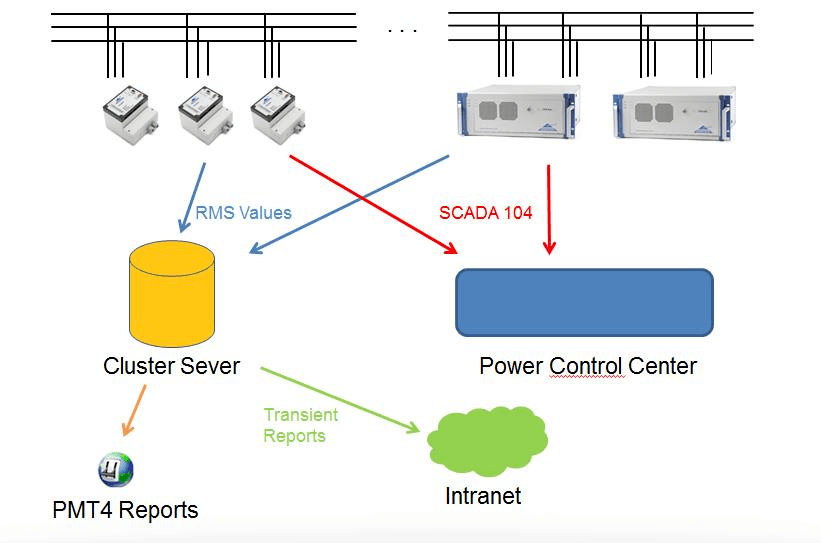
System overview (figure):

The system overview can be seen in the figure. All RMS values (10 min values) and transient (10 khz) of all devices are stored in the database on the cluster server. If transients occur in the grid, they will be automatically printed and stored on the network device. All reports from the database on the cluster server can be defined as a time interval according to different standards (especially EN50160), and can be completed with the analysis software OXYGEN. In addition, all real-time values can be obtained in the power control center using the SCADA 104 protocol.


