how Use Dewei Chuang OXYGEN Software
3.2.1 Online and offline data processing
This chapter introduces the difference between offline and online data analysis functions . As previously introduced , The software has three different operation modes : Online real-time display , Record and playback mode . In all data analysis functions , Analyze the data when watching the data online Jiaozuo online data analysis OXYGEN Number of software acquisition Establish mathematical formula according to. This part can be saved to the configuration file and cannot be deleted during offline analysis Among all analysis functions, the data analysis function after recording data is called offline data analysis . When browsing a When the data file has been stored Oxygen The software enters the data playback mode . In this mode, you can browse, analyze and count files Derived from . These channels can be deleted until the data file is closed . These added sub analysis options will not be protected It exists in the settings file. If you want to save it, you can create a new configuration file to save the added configuration options. Please refer to ⑤ chart . 3.10 ). The offline analysis option added is different from the original channel , Intuitively, the color of the storage button is different . The red one is the original one The green channel is the added offline analysis channel . In Figure three point five You can see , The two storage buttons are red , So they are Created before storage . The other two colors are green offline mathematical channels created during data playback.
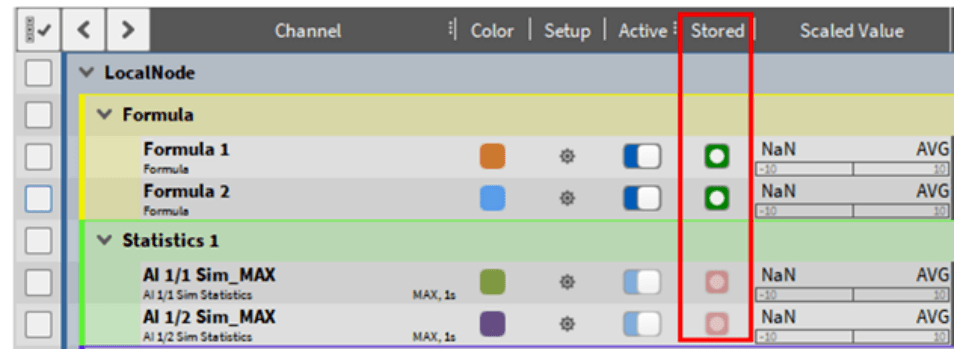
Fig. 3.5: The storage buttons for offline online mathematical analysis have different colors
3.2.2 Saving a measurement configuration file
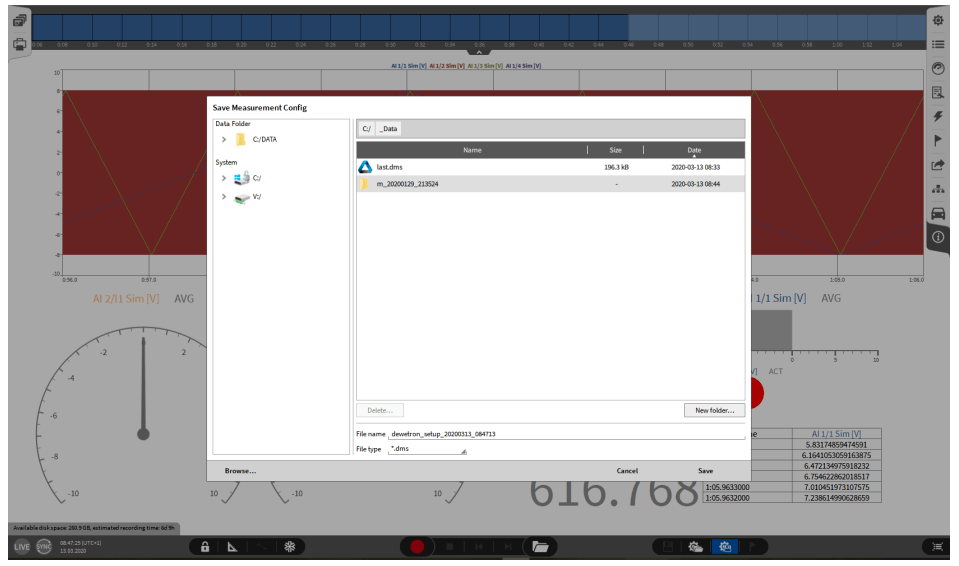
Fig. 3.6: : Save Profile
Save Profile : one Click with your finger or click the Save button with the left mouse button ( Refer to Figure three point six Or option ⑮ chart . 3.1 )
two After clicking this save button, a save file dialog box will pop up
three Through this dialog box, you can select a data folder to create a new folder or open any position of the computer Set to save the settings file
four Click the Save button to save a configuration file
3.2.3 Load configuration file
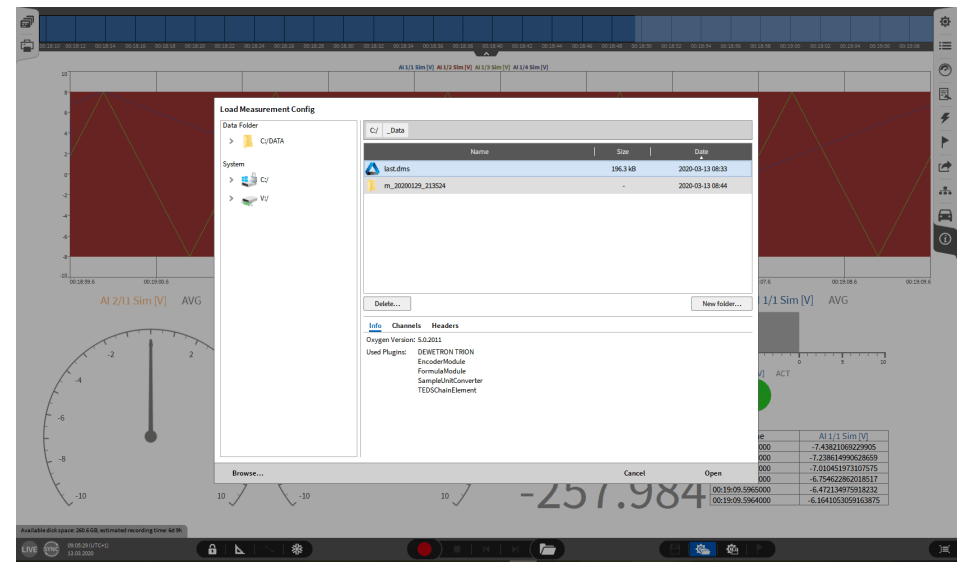
Fig. 3.7: Loading configuration file
one Finger click (touch screen) or left mouse button click the load configuration button ( Reference drawing three point seven Or option ⑭ in Fig. 3.1 )
two By clicking this button, a dialog box for loading configuration files will pop up
three This dialog box is convenient for users to load the required configuration. Note that the naming of the file naming header can be more flexible The required configuration file is found
four Click the browse button to open the computer resource manager to facilitate changing to other computer locations
five The Open button will open and view the selected configuration file
six If the hardware options in the configuration file do not match the device hardware, the hardware matching dialog box will pop up ( Refer to Figure three point eight ). This operation is convenient for users to match the existing chassis channel when using the hardware configuration file of other models . Perfect phase The same channel will automatically match, or use the automatic button to match ( Reference drawing three point eight ). Click lear to match the current The channel is cleared. After all the necessary channels are connected, the user can click the Accept button to complete the software loading configuration file piece
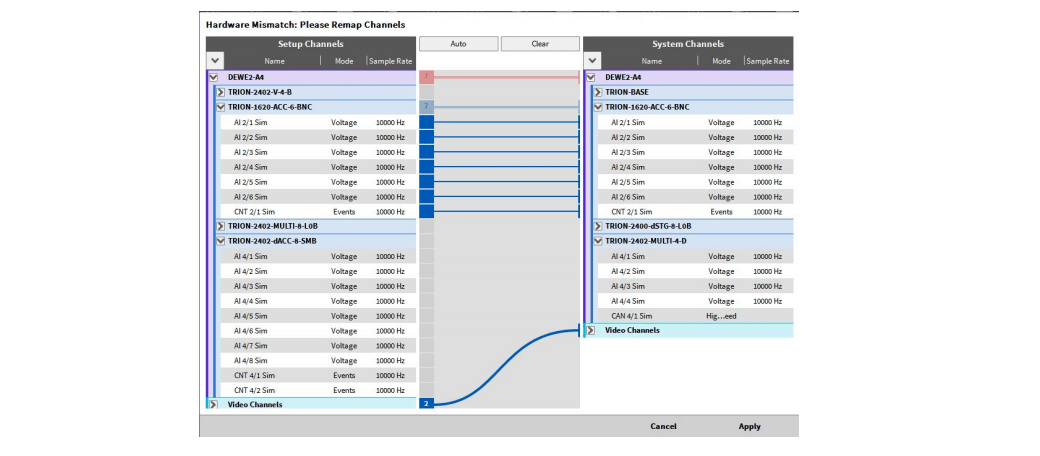
Fig. 3.8: Hardware Matching Dialog
3.2.4 Data browsing ( playback mode )
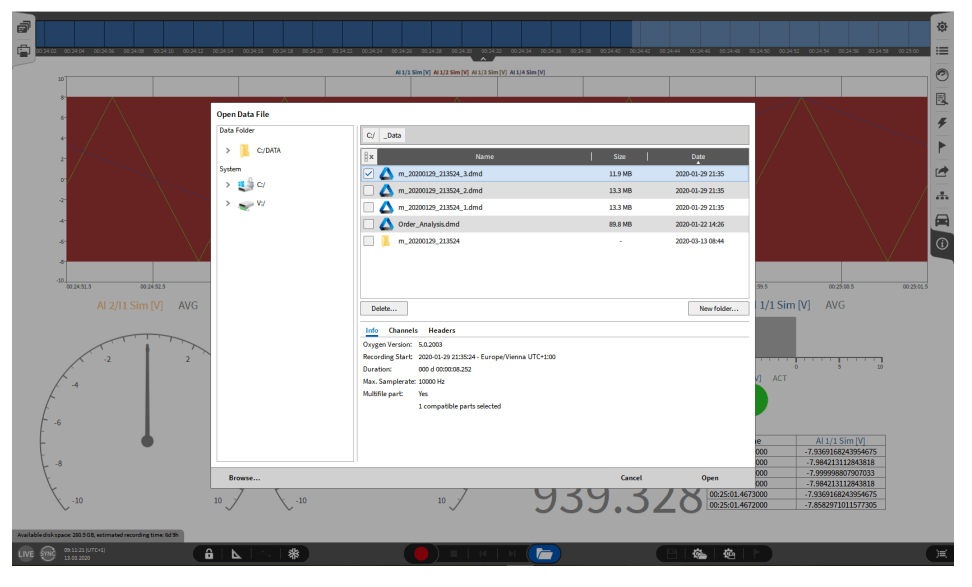
Fig. 3.9: Open Data File
one Touch or click the Open Data File button ( reference resources three point nine or ⑫ chart three point one )
two Select this option to open a dialog box of data file
three Select the correct folder on the left side of the menu to find the data to be analyzed
four Find the file to be analyzed. The analyzed file is a DMD data file, including the size name of the data file Date and time of weighing and storage
five Through this dialog box, you can select the data to be analyzed, and search the required data according to the file name and data header
six By clicking the browse button, Windows The Explorer dialog box will open, and you can browse the data folder on the right.
seven Click the Open option to open the corresponding file
eight There is a status bar at the top of the newly opened data file (see Figure three point one zero Or figure three point one In Ⓐ ) 。 The status bar is displayed here Events that occur during the quantum. as : Start, pause, resume, current play time and position, and record termination.
nine The user clicked the green playback button ( Pro reference ① chart three point one zero ) The yellow play line will go through the entire display screen The value of the corresponding time can be seen at the position where the color playing line reaches
ten The playback speed can be controlled through the speed button ( Please refer to ② chart three point one zero or chart three point one one ). The playback speed can be set in the 1000x reach 1/1000x Adjustable within the range . Note that audio files can only be played at one time of the original speed
eleven After data post-processing, you can click the Save button to directly save the processed data and overwrite the original data, or Save as another DMD file via the Save As function button. Select Popup ( Please refer to chart three point one zero ) Play speed button On the right, if you do not want to save the configuration of post-processing, you can directly select the Ignore button in the dialog box after clicking the Talk button . In this way, the OXYGEN software will return to the measurement mode and can be used to continue collecting data.
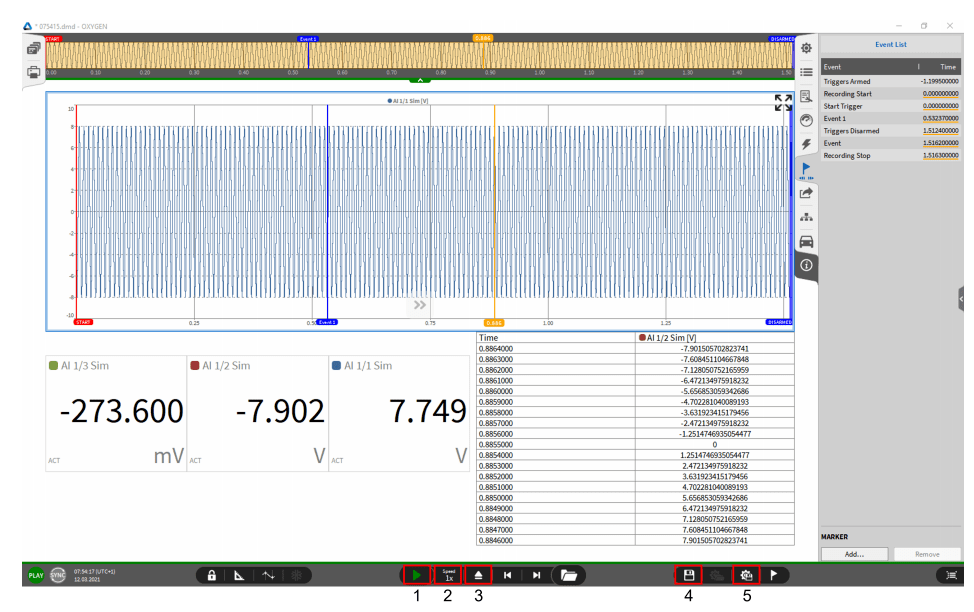
Fig. 3.10: Load Data File

Fig. 3.11: Adjust playback speed
be careful :
• In the data playback mode, you can also add display tools and edit the display interface through the setting button. For details, refer to add to Display tool matching channel .
• The recorder is a very useful display tool. After matching the channel, you can see all the events happening on the top Birth time, and some statistical values, special values, etc
• Event List ( Reference drawing three point one zero ) All events occurred during the whole recording process will be displayed in the list . How to add an event marker Record reference Event list function .
• Changes during analysis can be saved to data files through buttons similar to floppy disks ( Please refer to ④ chart three point one zero ).
• A Settings file changes during analysis can be saved by a button similar to a gear floppy disk ( please reference resources ⑤ chart three point one zero )
3.2.5 Customize menu order
OXYGEN Allow users to define the interface according to usage habits . Users can customize the location of all function icons . 。 This allows the user to simultaneously Open multiple menus. To change the order, the user can select the corresponding menu and hold the mouse button down for one second. Then the menu mark The blue background on the blog will appear. Now the user can move the menu to the desired position and press the icon with the left mouse button It moved past. You can also move the menu from the right to the left and vice versa.
be careful:
• You may not be able to restore to the default location after changing the location . To reset the menu position, enter System Settings get into UI Option and select the reset button under the sidebar Position section ( reference resources ① chart three point one two ).
• The user can also choose to place the toolbar on the left or right side of the software interface UI choose Item and select the left side under the sidebar position ( reference resources ② chart three point one two ).
• You can also change the width of the menu bar
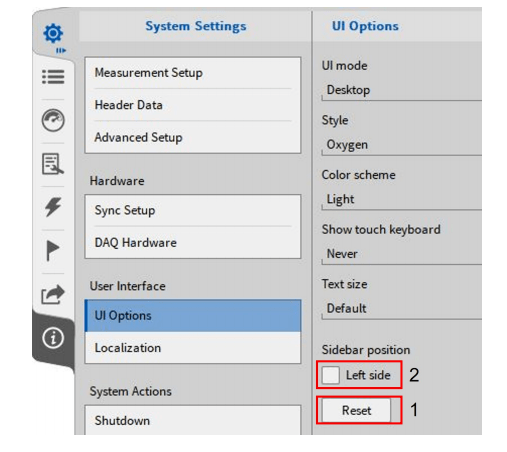
Fig. 3.12: Menu bar position reset
3.2.6 OXYGEN Browser
• Multiple can be opened OXYGEN Browser is used for data playback and analysis . The data file can be opened directly , Regardless of OXYGEN Whether the software is running, data can be analyzed while collecting . When OXYGEN software is running, this mode will open A new analysis window will prompt "VIEWER" , Reference drawing three point one three
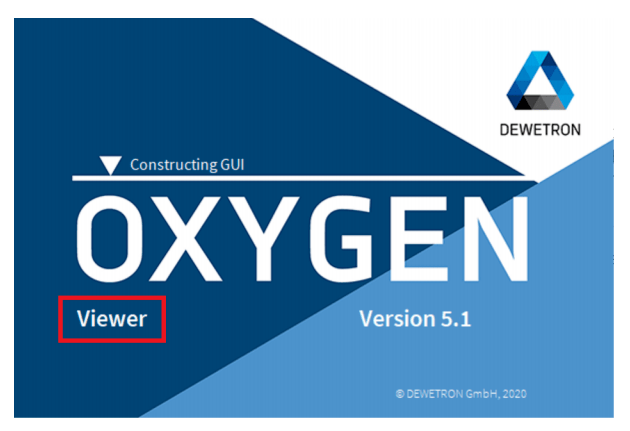
Fig. 3.13: OXYGEN Browser launch interface
• The core function of recording data can only be used in the main OXYGEN Window, however, all other functions, such as post-processing functions You can also use the Viewer Mode. In addition, this mode can be used to view recorded data files during recording File by opening it in viewer mode.
• If a file pops up in browser mode ( Please refer to three chart three point one zero ), A reminder will appear in the open data file Above button i Reference drawing three point one four . Other data files can be used for post-processing
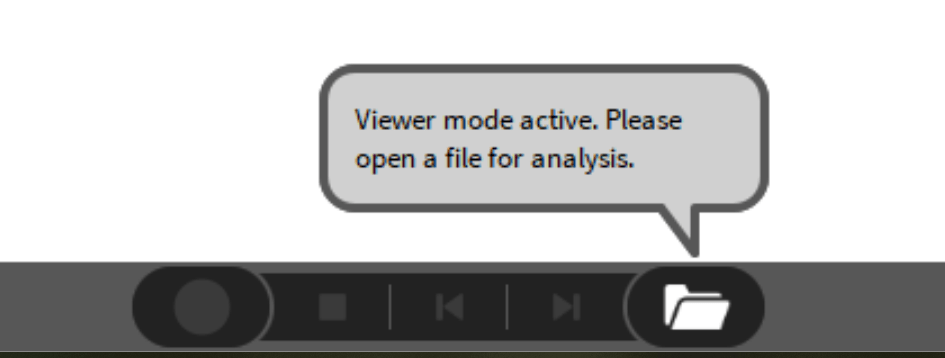
Fig. 3.14: OXYGEN Browser Considerations


