Dewei Chuang OXYGEN software test interface
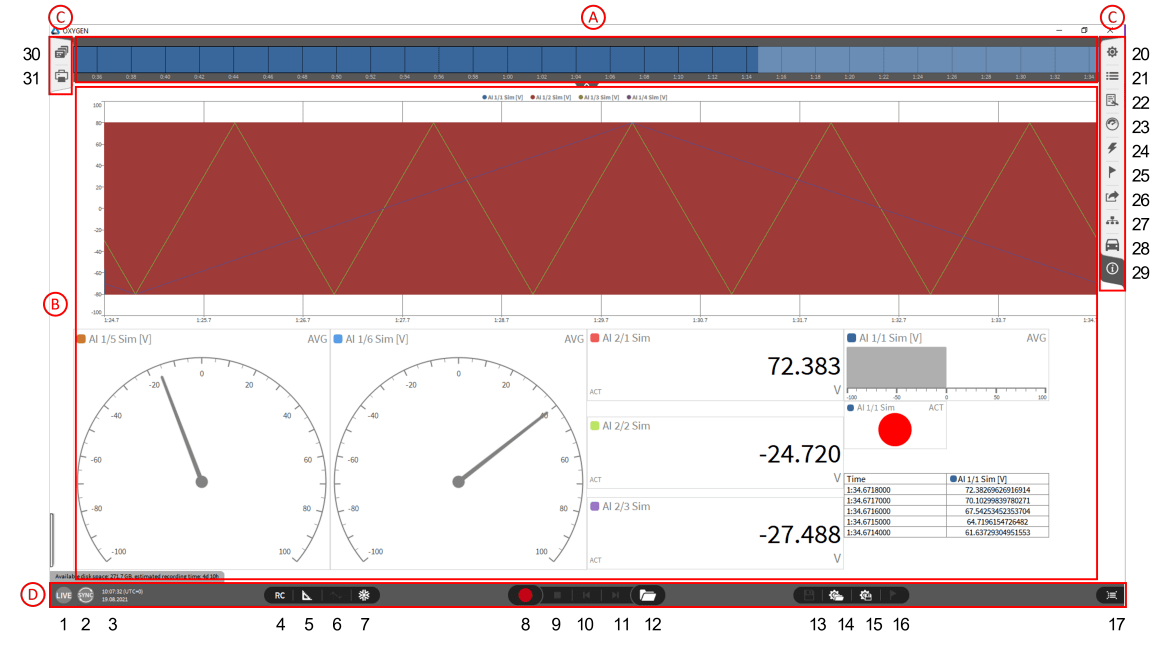
After opening the software, the display interface shown in the following figure will appear in the field of vision OXYGEN The software starts to display data information, but does not store data

Fig. 3.1: Software overview
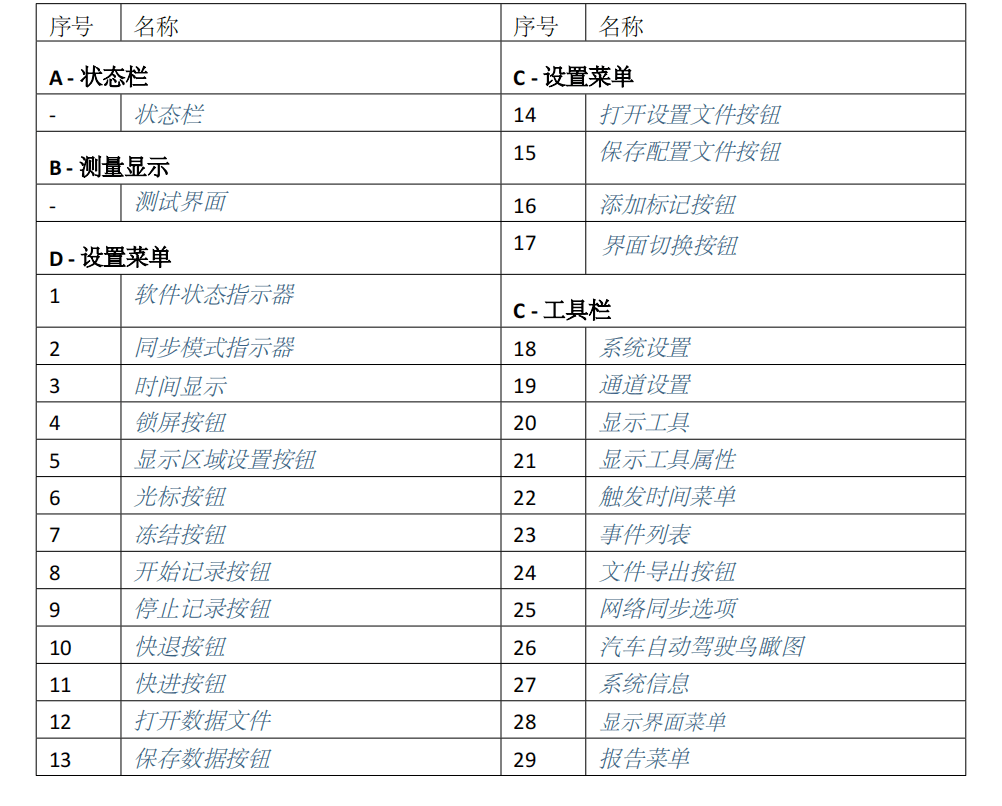
Table 3.1: Software overview

3.1.1 Status bar

Fig. 3.2: Status bar
The status bar can roughly display the test data waveform . Display the general trend of the selected data waveform in the time domain . In data browsing and distribution Analytic period , The data marked in the orange box is the data displayed on the display tool of the lower display interface. ( Refer to Figure three point one one ). The user can set the display channel. The status bar can be displayed by dragging the channel in the data channel list to the status bar Channel switching ( Refer to Figure three point two ).

Fig. 3.3: Switch the status bar to display the channel and display the trend of the selected channel in time domain
3.1.2 Test interface
The default test interface of the system will set some display tools to display test data .
• Add display tool or edit test interface in test interface , Please refer to Add display tools and assign channels .
• Please refer to Display interface menu .
3.1.3 Setup Menu Contains multiple functional buttons .
Data storage button Start or pause recording
Stop recording button Terminate the data being recorded or the data browsing mode and return to the measurement mode .
Fast back button Available in data browsing mode ; Clicking this button will rewind the data playback to five seconds ago.
Fast forward button Available in data browsing mode ; Click this button to fast forward the data for five seconds
Open Data File button Select the data to be analyzed in the data folder and enter the data browsing mode
Data storage button Store changed data in browse mode , The original data will be overwritten. Of course, you can also use the "Save As" function Can store the processed data as a new DMD file

Fig. 3.4: Save as a new DMD
Open settings file button Please refer to Load Configuration File for details of opening the stored configuration file
Save Profile Please refer to Save Configuration File for details of saved configuration file
add mark button Add a mark on the time domain curve ; Available in both storage and browsing modes .
Lock screen button Lock test interface
Test interface setting button Open this button to add, delete, zoom in and zoom out the display tools in the test interface . For details, please refer to Add Reality Tool Hetong Channel assignment
Cursor button Activate measurement cursor ; Please refer to the activation cursor for details
Freeze button Freeze the current test interface
Status indicator Display the current working mode of the software . OXYGEN The software has three different working states : real-time display , Record and playback . Software implementation The status will be displayed in the status bar in real time when ( reference resources ① chart Fig. 3.1 ). The following describes the attributes of different modes :
• real-time display : OXYGEN Only obtain and actual data parameters, but do not store data as files . When the software opens the measurement The action can be activated at the end of playback or playback
• Recording mode: OXYGEN starts to record data and save the data as a file. The red line on the status bar identifies this function OXYGEN automatically saves data into a file It is not necessary to add an instruction to store the acquired data into a file To change the storage settings, refer to Measurement Settings
• Playback mode: This function is used for Huifang to analyze and export data Loading the storage file will activate the status change On the status bar The green line identifies the status
Synchronizing indicator Display the synchronization status of the current software
Time display Display the current time , Time and date ; It can be displayed on the test interface by dragging f For details, please refer to the text tool
Interface switch button Quickly switch to the channel setting interface ; Used for fast switching between current test interface and channel setting interface
3.1.4 Toolbar
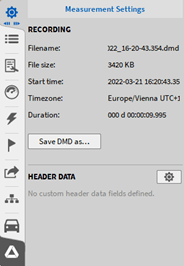
System Setup Menu Open the system settings menu ; For details, please refer to Measurement settings .
Channel Setting List Open the data channel setting list ; For details, please refer to Data channel list .
Show tool list Please refer to Display Tools and Display Tool Properties .
Show tool properties Opens the properties of the selected display tool ; For details, please refer to Display Tools and Display Tool Properties . The tool properties can be displayed by double clicking The display tool should be opened
Trigger Event List Open Trigger Event List ; For details, please refer to Trigger event function .
Event List Open the list of events that occurred in the stored procedure ; For details, please refer to Event list function .
Data export options Open the data export function option ; For details, please refer to Export settings function .
OXYGEN-NET Feature Options open OXYGEN-NET function ; For details, please refer to OXYGEN-NET .
System Information List After opening, you can see the relevant system information including software activation code, software version, etc
Display interface menu All display interfaces can be seen after opening ; For details, please refer to Display interface function . Report List Open for real-time reporting ; For details, please refer to the report function


