TRION3-AOUT-8 stay OXYGEN Application in software
This section mainly describes how to use it in OXYGEN TRION3-AOUT modular . To use this module TRION3 -AOUT need To and RION3-18xx-MULTI Modules are used together and need OXYGEN Software version higher than 5.4 . Matching of these two boards It needs to be completed in the factory. You cannot change it by yourself For more details, please refer to TRION3-AOUT instructions , On the website www. dewetron -tech.cn. Can be downloaded TRION3-AOUT-8 The board has two operation modes:
• Conditional signal output
• Calculate channel output
Conditional signal output
TRION3-18xx-MULTI Support direct or programmed signal output . Can be ±5 V, ±10 V or 0-10 V Of Direct output of analog signal or numerical output after processing such as effective value and average value
Calculate channel output
Any channel or TRION3-18xx-MULTI Can be activated FPGA Basic operation and output ±5 V, ±10 V or 0-10 V Simulation of Signal, These two functions can be divided into four working modes , OXYGEN Software can be set :
• Analog channel output
• Mathematical function calculation output
• Constant output
• Function generator
This pinion button chart four point three You can open the settings of each channel .

Fig. 4.3: Open channel settings TRION3-AOUT Module
The setting is divided into three parts As shown in the figure four point four Output amplifier options, mode channel settings and scaling information

Fig. 4.4: output setting TRION3-AOUT Board
In the Output Amplifier option, you can select the corresponding mode. Next, each mode and corresponding settings will be noted. The output multiplication can be defined , ±5 V, ±10 V, 0-5 V, 0-10 V, ±30 mA or 0-30 mA It can be output directly For output mode, you can select two different options : High speed or high resolution. The following table explains the difference between the two modes Different.

Table 4.1: Difference between high-speed and high-resolution TRION3-AOUT Board
This section can also select a low-pass filter according to the cut-off frequency and filter characteristics. If the output range of TRION3-18xx MULTI module exceeds the possible output range of TRION3-AOUT module, the signal will Scale accordingly. This zoom information can be seen in the zoom information section. The following figure is an example chart four point five .
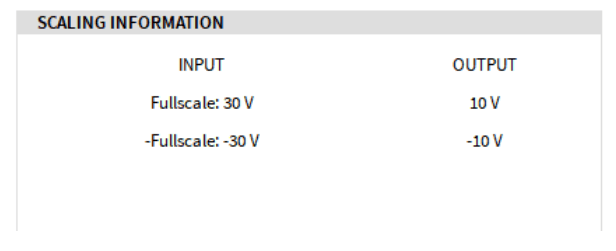
Fig. 4.5: Scaled data
4.2.1 Analog channel output
chart four point six The analog channel output mode is shown . In this mode TRION3-18xx-MULTI The value of the input channel on the card office can To output via AO card . The data source can be selected by clicking the position circled by the red box As shown in the figure four point six . chart four point seven dialog box Shows how to select analog channels. Only one channel can be selected at a time

Fig. 4.6: Analog Output Settings
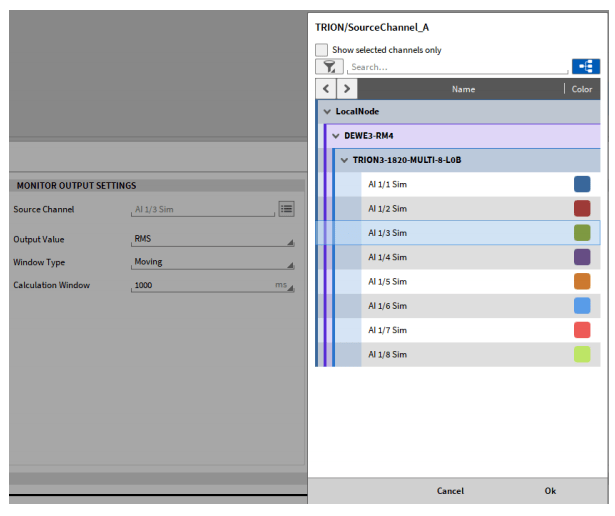
Fig. 4.7: Data source channel selection
It can output the average value and effective value of the time value collected by the TRION3-18xx MULTI board . If the average value is selected or there is Two additional setting options of the effective value will appear for reference chart four point six right . The window type can be fixed or changed to calculate the Values can be selected from the drop-down list or entered manually.
4.2.2 Mathematically calculated value output
chart four point eight Shows the mathematical calculation output function . Again, the two signal source channels can be selected through the positions marked on the figure As shown in the figure four point eight . meet The next three adjustable mathematical operation functions can process two channels :
• A + B
• A – B
• A * B

Fig. 4.8: Math Calculation Output Settings
The actual value, average value or root mean square value of the result of mathematical calculation can be output. If you choose average or root mean square, there are two more Additional settings As shown in the figure four point eight right, The window function type can be fixed or mobile. The value of the calculation window can be selected from the drop-down list or entered manually.
4.2.3 Constant output
As shown in the figure four point nine Shows the setting of constant quantity output . No need to select signal source channel . Fixed value within the output range ( As shown in the figure four point four one Four constant values in the range can be output . The value can be adjusted through the slider or entered manually
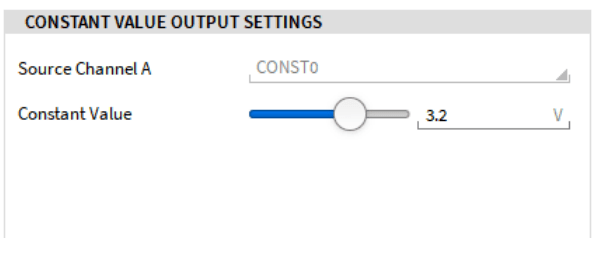
Fig. 4.9: Constant output setting
4.2.4 Function generator
Function 'function generator' Please refer to chart four point one zero
· Waveform: sine wave, square wave or triangular wave can be selected in the user-defined waveform setting option (refer to Fig. 4.10) more For detailed information, please refer to the custom waveform
·Frequency: frequency can be selected from the drop-down list, or a separate value frequency range can be entered 0.001 Hz - 1 MHz ·Amplitude: copy can set 0 – 10 V or 0 – 30 mA peak or effective value
·Offset: ± 10 V or ± 30 mA offset optional ·Phase: ± 180 ° phase difference can be customized
·Symmetry and duty cycle: this option is mainly for wave prevention and triangular wave, and the definable range is 0.001 – 100 %.
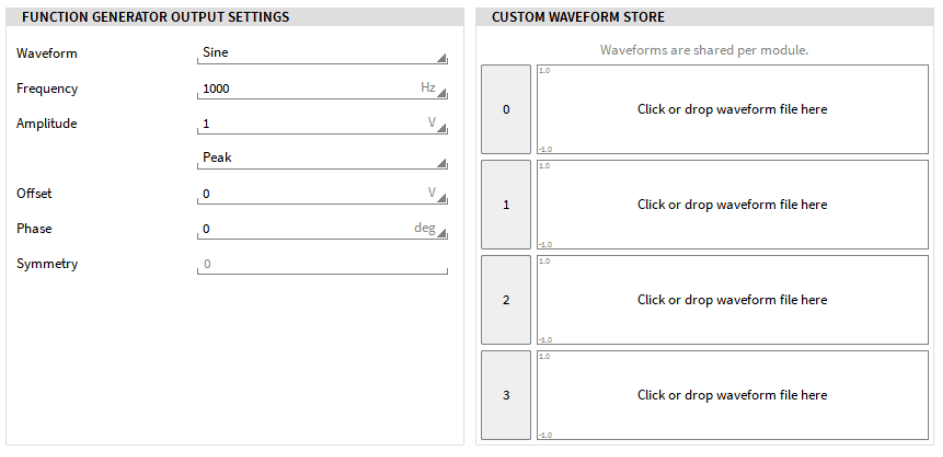
Fig. 4.10: Function waveform setting
• The file format must be CSV
• Each line is only one sampling point alive
• Only values of - 1-1
• Separator must be . ( English full stop )
• allow sixteen thousand three hundred and eighty-four Line
4.2.5 Custom Waveform
If you want to use a custom waveform, the 0-3 option must be in waveform output mode. In the custom waveform bar Four different waveforms can be defined Only one waveform can be selected for each output channel Customized waveform can also pass through points Click the pull-down menu and select the custom waveform in the corresponding folder The waveforms defined in also need occupied modules; because These four different waveforms can be defined and output in one module These waveforms are also saved in the configuration file Some custom waveform loading rules: The defined waveform corresponds to a cycle and will be repeated periodically. Figure 4.11 shows three different defined waveforms and the waveform selected by Pattern2 in the current setting
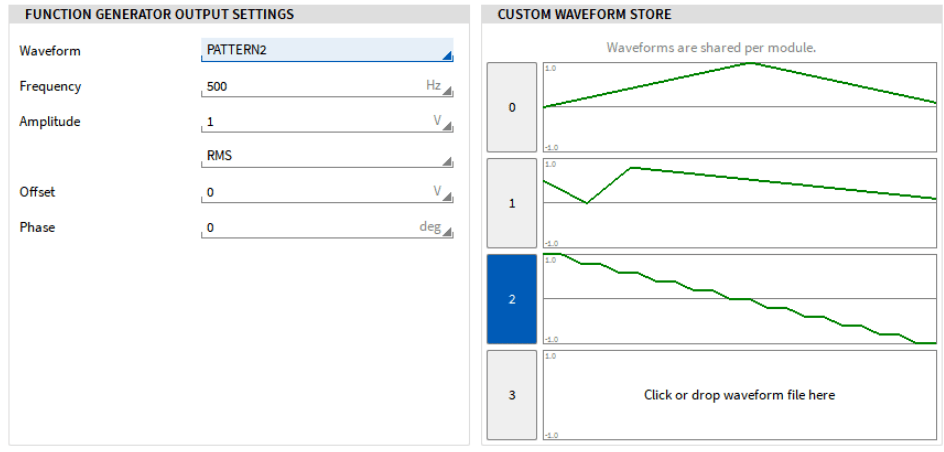
Fig. 4.11: Function generator custom waveform
4.2.6 Data stream output Data stream output is used for analog output of collected data files . This mode only supports .dmd file . In data file The channel data of TRION3-AOUT Output channel output on the module . TRION3-AOUT Also supported as an independent module This output mode . To use this mode, the software must be in L data acquisition mode or recording mode, which is not supported in data playback mode To use this mode, follow these steps:
• Open channel settings for each channel , Enable these channels to be used for data stream output ( Reference drawing four point one two . )
• Change the mode to data stream output mode, and adjust the output range and output signal type ( Voltage or current ) 。 All others Settings, such as loading data files, must be completed in the corresponding instrument
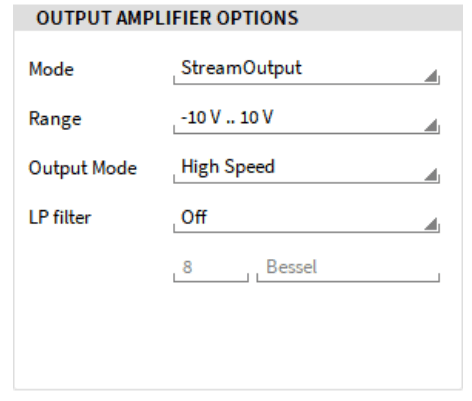
Fig. 4.12: Data stream output setting interface
• Return to the measurement interface and open the display tool option . There is a separate tool for loading data files and selecting which ones to export / As a data flow channel. reference resources chart four point one three , You can drag the display tool to the measurement interface, or zoom in or out Tools to proper size .
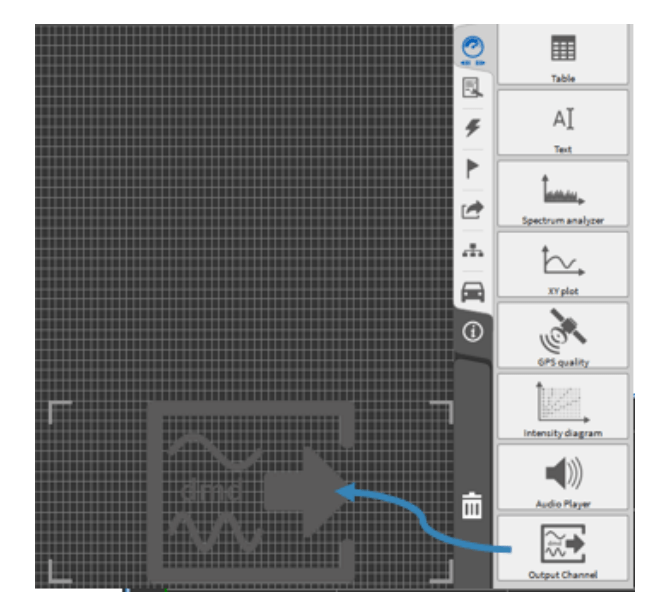
Fig. 4.13: Add an output tool to the measurement interface
• Open the data channel list, do not fully expand, select the data channel to be output . Select display tool matching channel . display Show tools most large Eight channels can be used .
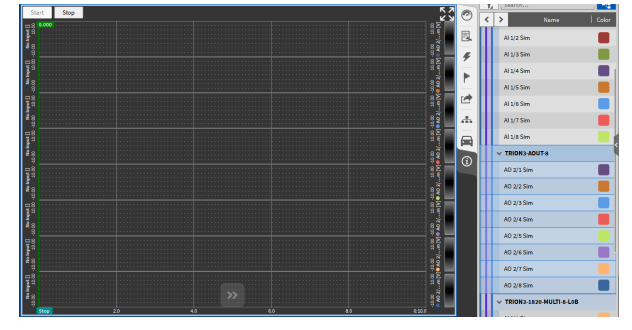
Fig. 4.14: Select Output Channel
be careful : Only channels with data stream output can be used in the display tool If you are using analog output channels If another mode is selected in the setting, the instrument itself will have an alarm reference chart four point one five . Turn on all channel settings when this happens And check the setting mode

Fig. 4.15: Error mode alarm
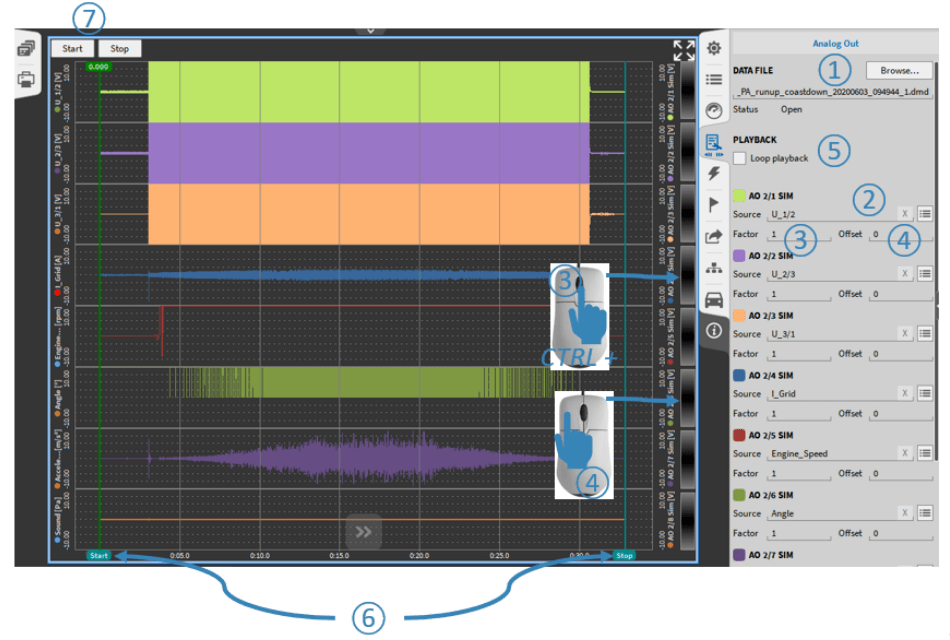
• To load the data file and select the channel to output, you can open the instrument properties by double clicking the instrument itself or selecting the instrument Menu Tab( ( as chart four point one six ).
• ① Select the playback. dmd data file in off-season
• ② Assign analog input channels to output channels
• ③ Adjust Output Scale Factor
• ④ Adjust the output offset if necessary
• ⑤ Loop playback, otherwise the data will be output only once .
• ⑥ Use the cursor to replay only a part of the data file
• ⑦ Start Stop Pause Data Playback Fig. 4.16: Data Flow Output Display Tool Properties
