Test standard for automobile headlamp
The Headlamp Testing and Rating Agreement issued by the European Insurance Association for Highway Safety specifies a test scenario that is specifically used to evaluate and test the road lighting provided by the vehicle headlamp system. During the test, the tested vehicle (VUT) shall travel along five different tracks: 250 meters straight, 150 meters radius left and right curves, 120 meters long, 250 meters radial, and 120 meters long left and right curves. The illuminometer at the end of the track measures the light emission of the headlights during the approach. The VUT is operated by the driving robot to ensure the repeatability of the test.
Vehicle headlamp test challenge
The following challenges arise during testing
>IMU data acquisition to determine the location and precise speed, and measure the relative remaining track distance when the car is traveling along a predefined route
>CAN data collection, used to collect vehicle data during the test
>Distributed and time synchronous data acquisition Vehicle CAN data and IMU data are located at the end of the track in the mobile VUT and analog illuminometer data
>Determine the lateral track offset of the VUT and the relative remaining distance from the end point when the vehicle is traveling to prove the repeatability of the test procedure
Hardware
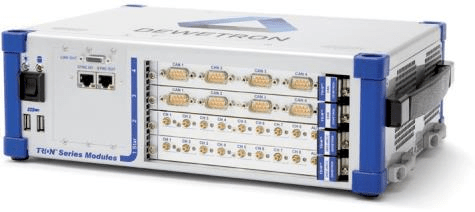
>One DEWE2-M4: installed in the mobile VUT, used to collect vehicle data via CAN and IMU sensor data via Ethernet.
The system includes the following modules:
>1 TRION-CAN module: data acquisition module for CAN data
>One TRION-TIMING synchronization module: TIMING module, which is used to receive GPS signals and realize time synchronization of the system
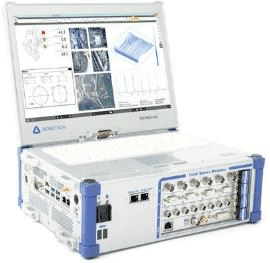
>One DEWE2-A4: fixed at the end of different tracks for collecting sensor data such as illuminometer. The system includes the following modules:
>1 TRION-1603-LV Module: 6-channel isolated data acquisition module for low-voltage signals up to ± 100V; The number of modules depends on the number of illuminometers.
>One TRION timing module: Timing module, which is used to receive GPS signals and realize time synchronization of the system
Software
OXYGEN The data acquisition software runs on each DEWETRON system at the same time. The software includes:
> OXYGEN-NET : Used for networking and synchronous data collection of all DEWETRON devices. Support any device to remotely control and set channels for all other devices through the network; The collected data of each device can be transmitted to the control system in real time through Ethernet (WiFi), and be backed up for storage
> IMU plugin : Extended function, DEWETRON equipment can directly obtain IMU sensor data through Ethernet; One DEWETRON system can conduct time synchronization and synchronous data acquisition for up to six IMU data streams; IMU: GeneSys ADMAs and OxTS RT supported to avoid timing uncertainty when receiving IMU data via CAN;
> Automotive plugin : Generate all moving and static objects involved in the test environment in the software, and display them visually on the map in real time during the test, and calculate the relative distance between them in real time online; This is a necessary function for the DEWETRON system at the fixed end.
Other third-party hardware required for headlamp evaluation :
>IMU sensor, used to determine the position and precise speed of VUT (such as Genesys ADMA-G-PRO+or OxTS RT)
>Driving robots, used for autonomous steering vehicles, to ensure the repeatability of the test (e.g. St ä hle SAP2000 or ABD)
>Illuminometer, used to determine the light brightness range when the car approaches the end of the track (e.g. Konica Minolta T-10A)
Advantages of OXYGEN software
>Distributed acquisition network
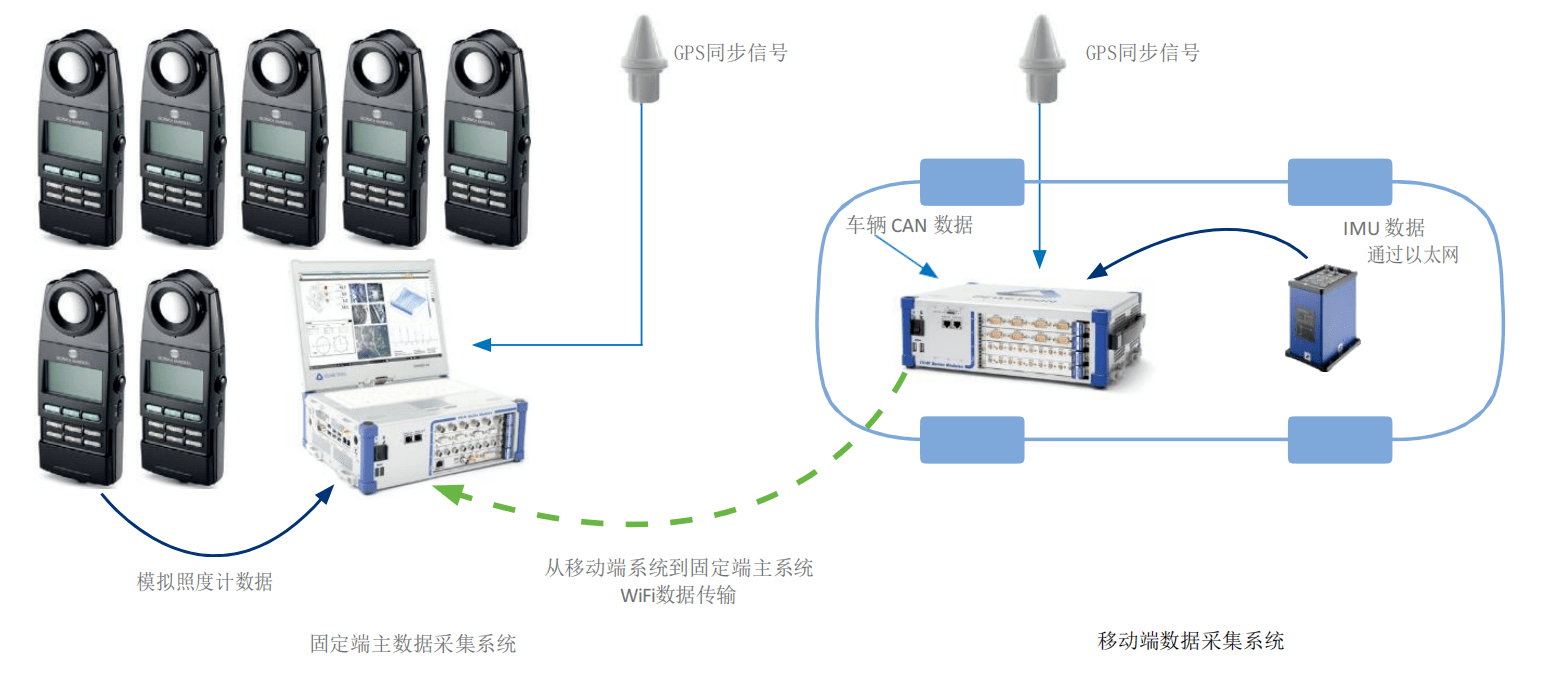
The OXYGEN Net function enables test engineers to set up a large local Distributed data collection System. All subsystems can be remotely controlled and configured through the main system. All subsystems can be started remotely and synchronously through the main system. The data of all subsystems can be transmitted to the main system online in real time through Ethernet, and stored in a data file synchronously. Support backup data storage for backup in case of network errors. The time of all systems is synchronized through GPS and all measurement data is transmitted to the main system in real time through WiFi network. This makes DEWETRON system a special solution for ADAS testing. Since data is synchronized online through GPS, manual and time-consuming post data synchronization will become a thing of the past. It should be noted that the WiFi network bandwidth And coverage.
>Shape Editor:
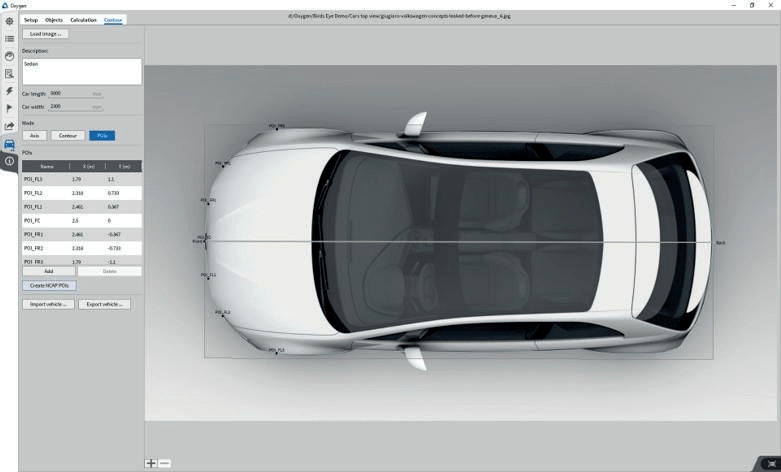
With the shape editor, you can create virtual vehicles, pedestrians or obstacles in the software with just a few clicks. This virtual vehicle, pedestrian or obstacle can be saved as a file, and multiple test points of interest (POI) can also be set on these virtual figures, such as the center of gravity, the geometric center of the car or the precise position of the headlights. The OXYGEN Automotive plug-in can be used to calculate the distance from other vehicles, pedestrians (VRU), lanes and predefined tracks in real time.
>Calculate the relative distance between test objects:
During the headlamp evaluation test, the virtual vehicle created enables the test engineer to accurately determine:
>Lateral rail offset of VUT
>Remaining distance from VUT to the end of the track
>Deviation between VUT and rail end
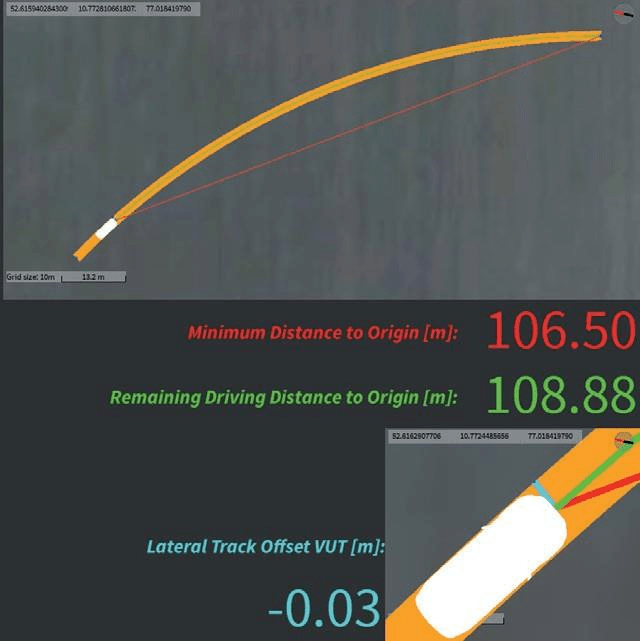
The distance calculation can directly reference any test point (POI) created in the virtual drawing. For example, the lateral rail offset of VUT can be determined by referring to the geometric center of VUT and the center of front bumper of VUT. The irradiation distance can be calculated by the position of the left or right headlight. The distance is calculated online and the time is synchronized with the illuminometer data. Therefore, the overall evaluation of the vehicle headlamp system can be generated in real time during the test. After completing three valid tests for specific test conditions and measurement locations (for example, the right edge of the carriageway), the visibility distances of the three tests are averaged. Using these averages, visibility and lighting defects are calculated separately and then summed to determine the overall rating of the headlamp system.
>Visualization of the test site:
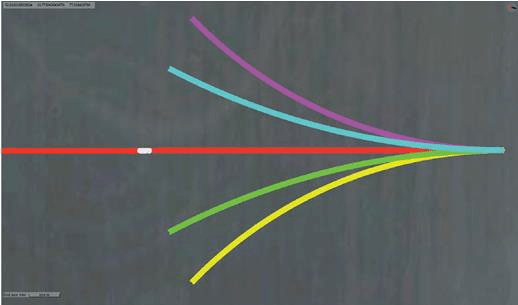
All test settings and test objects in the test can be displayed in the satellite image or OpenStreetMap in the software ® Visualize on. In order to better view and interpret the data, all the test sites and road satellite cloud images can be updated online, whether during the test setup, or later during the data analysis and post-processing, to provide accurate visual information.
More features
DEWETRON can not only provide you with a complete solution, but also allow users to complete other vehicle regulation tests through the device. During the test, the DEWETRON system can collect almost any sensor data. DEWETRON provides a wide range of signal conditioning and A/D conversion modules, which can be installed in the DEWE2-A/M4 or any other DEWE2 chassis. Whether it is analog or digital sensor data, CAN data or UDP sensor data transmitted through Ethernet, all data streams can be synchronously collected with the DEWETRON system and stored in the same data file to ensure the truth of singleness. Support various external synchronization signals: IRIG, PPS, GPS or PTP (IEEE 1588). OXYGEN provides a powerful mathematical module to perform online signal processing. With just a few clicks, you can add mathematical operations, statistical calculations, signal filtering and spectrum signal analysis, and update them online. In addition, data can be exported to different file formats to provide interfaces for third-party software packages for dedicated and automated user-defined data post-processing.


