DVC power analyzer Application of PLC in output detection and power control of energy storage converter
Output detection and power control of energy storage converter
Test the voltage, frequency and power at the AC side of the inverter or converter. The high precision and high precision of the DEVCRO power analyzer sampling rate It can accurately test the transient voltage and voltage deviation, and accurately calculate the frequency and power of AC power.
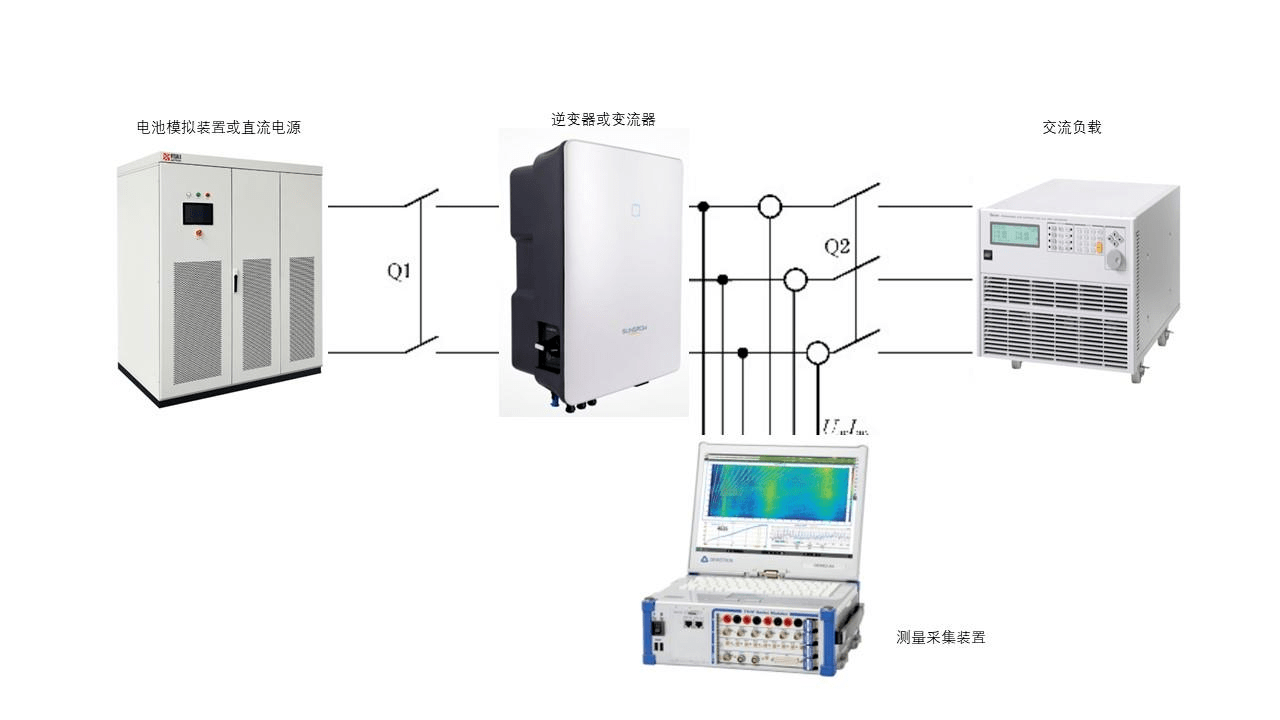
Output detection circuit
Output detection and power control of energy storage converter Equipment used:
DEWE3-A4
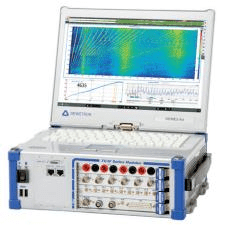
TRION-1820-POWER-4

DEWE3-A4 integrated portable host:
2 pieces can be added TRION-1820-POWER -4 acquisition cards, collecting 8 channels of voltage and 8 channels of current; The range of high-voltage channel can reach ± 2000Vpeak, and the range of current channel can reach 40Apeak; The sampling rate can reach 2MS/s, and the resolution is 24bit. Test accuracy: DC ± 0.02% * reading ± 0.02% * range; AC 0.5~1kHz: ± 0.03% * reading without range error; There is no gap storage, and the signal waveform can be viewed without oscilloscope.
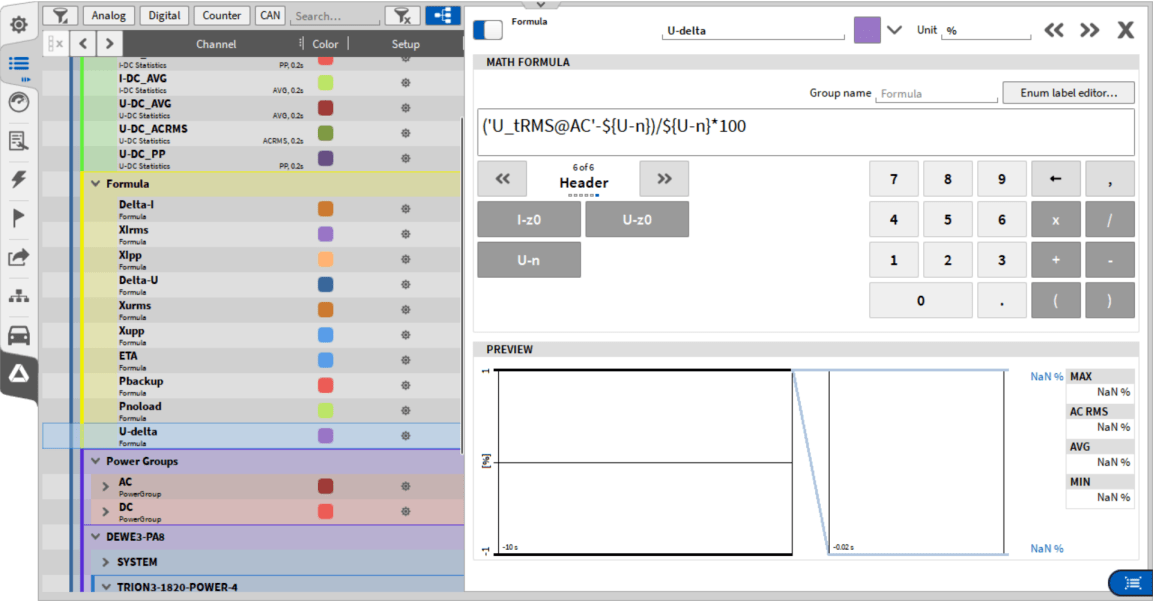
1 Output voltage deviation detection Add formula to directly calculate voltage deviation
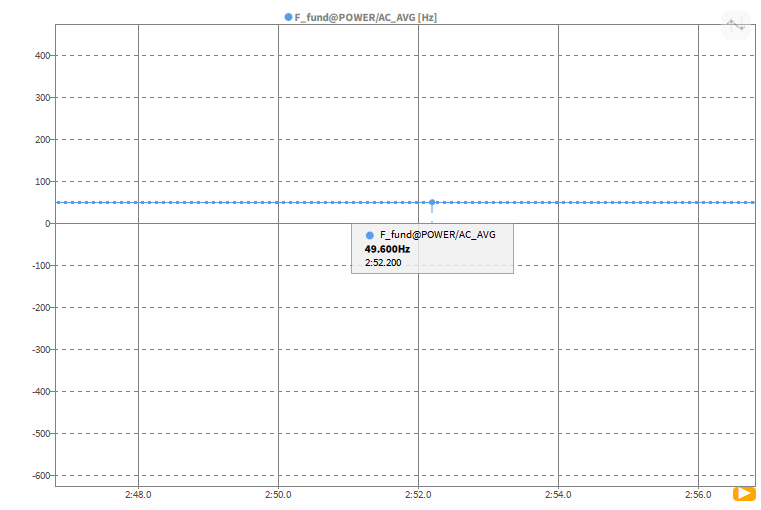
2 Output frequency deviation detection Add formula to directly calculate frequency deviation
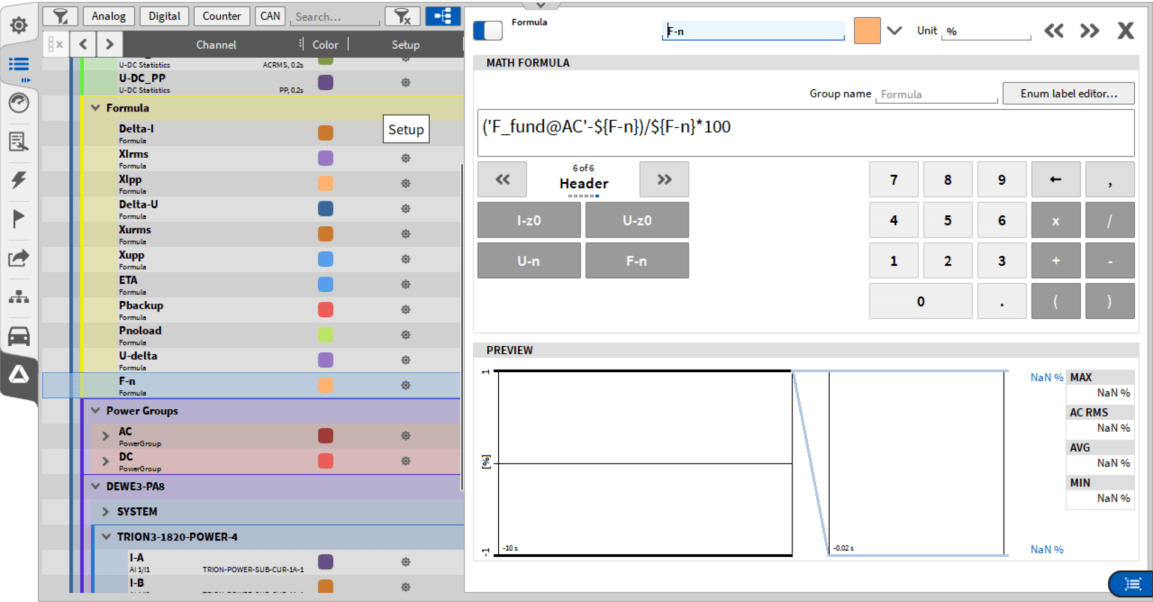
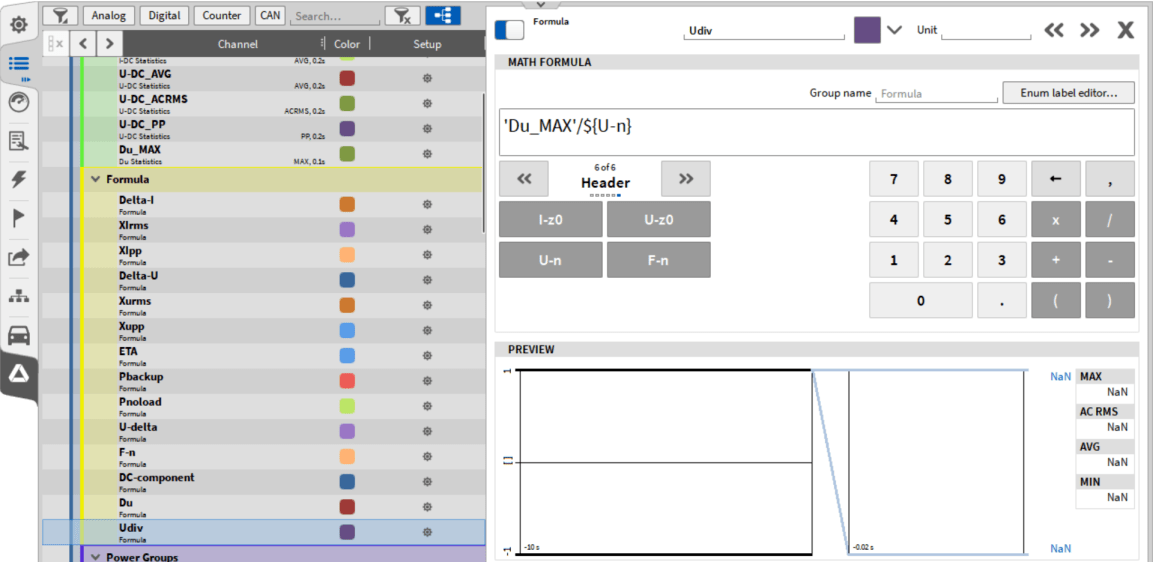
3 Voltage dynamic transient value detection Use statistical calculation to calculate the deviation between the effective value of AC voltage measured by the converter and the rated value after sudden load application or sudden load removal, and then use the function formula to calculate the dynamic transient range of output voltage.
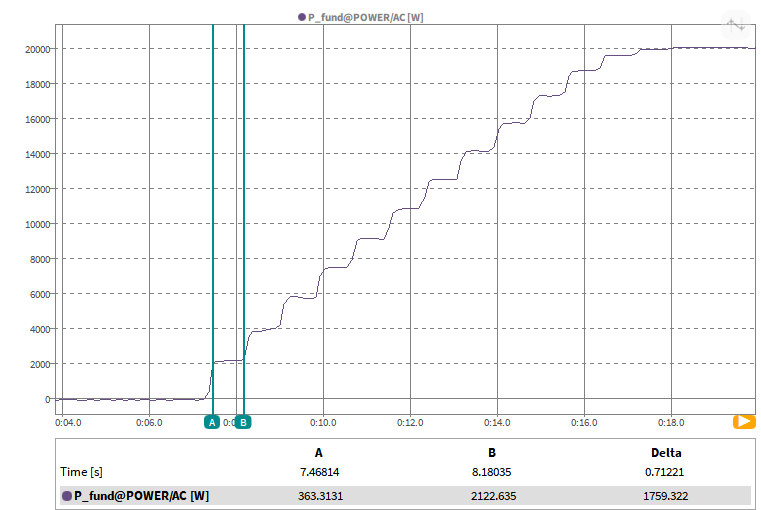
4 Active power control detection adds statistics to calculate the average value of active power 0.2s, and adds formulas to calculate the power control accuracy. Record the active power waveform with the waveform diagram, and add the cursor to calculate the response time.
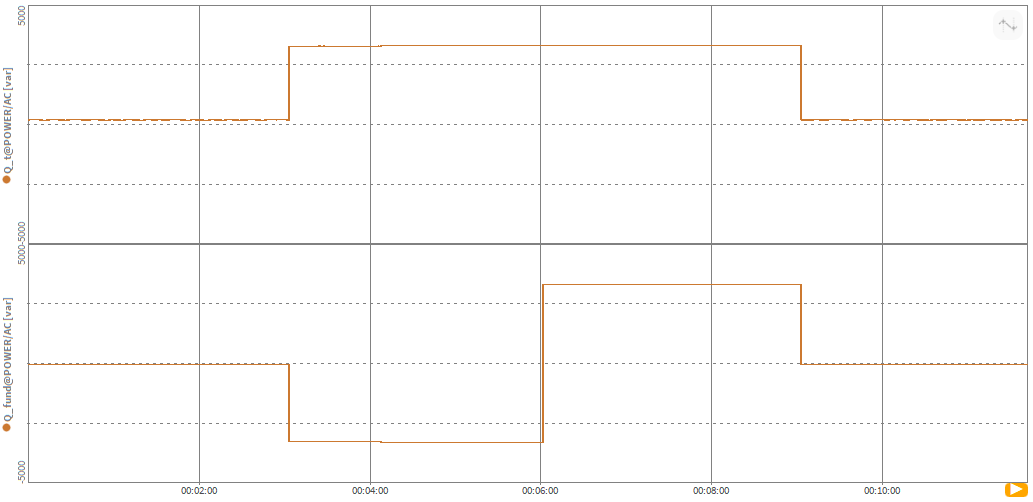
5 Reactive power control capability detection adds statistics to calculate the average value of reactive power 0.2s, and adds formulas to calculate the power control accuracy. Record the reactive power waveform with the waveform diagram, and add the cursor to calculate the response time.
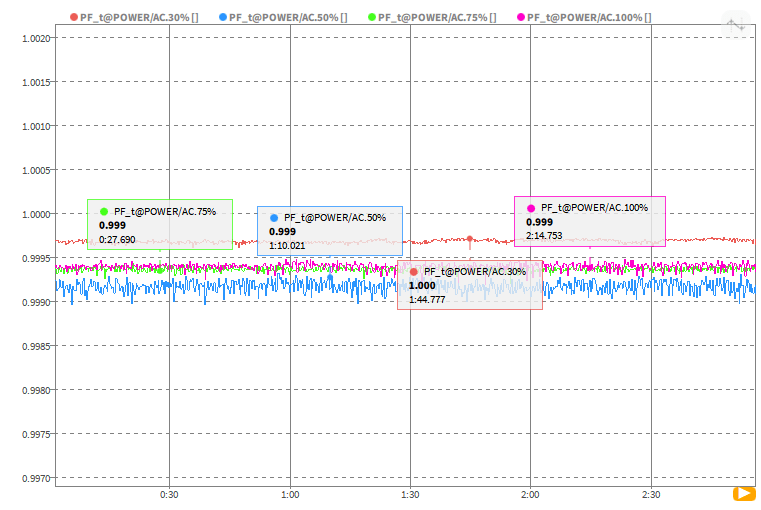
6 The power factor detection power analyzer can open the test data under different power conditions together in the software and analyze them in the same waveform recorder.
7 Frequency adaptability detection uses oscillogram to record frequency change Voltage adaptability detection uses oscillogram to record voltage change
