Application of Data Acquisition Device of DVC in Low Voltage Ride through Capability Test of Energy Storage Converter
Release time: 23-01-13 11:09 Number of views: twenty-four
Data acquisition device of DVC Application of PLC in the detection of low voltage ride through capability of energy storage converter
Detection of low/high voltage crossing capability of energy storage converter
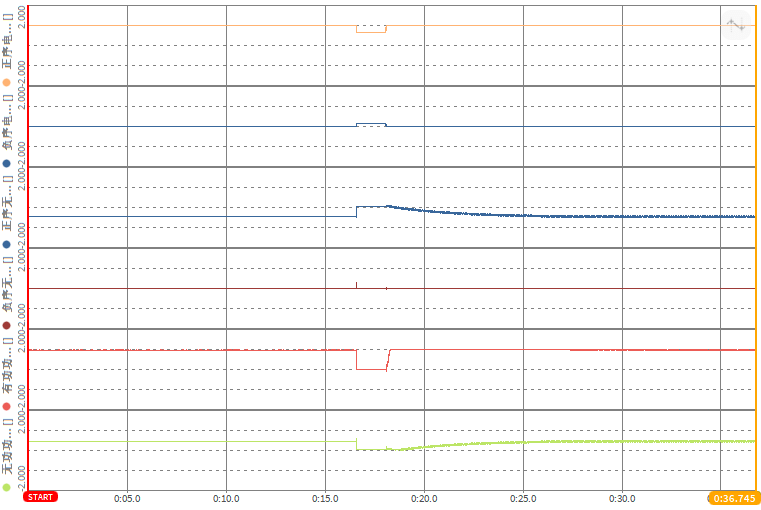
DVC data acquisition device and power analyzer can calculate and record the rapid changes of voltage and current. The positive and negative sequence components of active current and reactive current can be calculated directly.

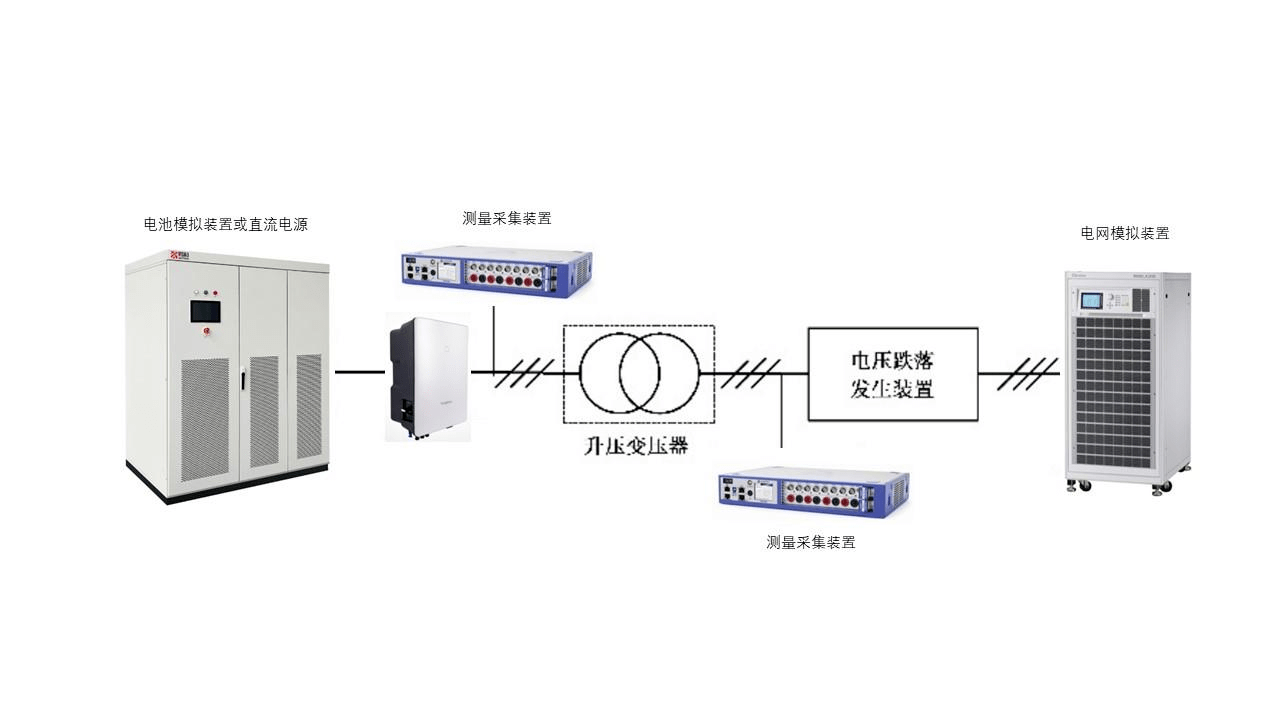
Low/high voltage crossing capability detection circuit
Inspection of low/high voltage crossing capacity of energy storage converter Test equipment:
Host TRIONet

Module TRION-1820-POWER

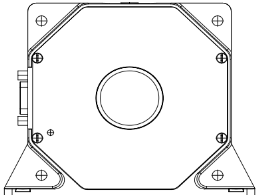
Sensor CT-1000

TRIONet portable recorder
If it needs to be connected to an external notebook or used in conjunction with work, 1 additional notebook can be installed TRION-1820-POWER -4 acquisition cards, collecting 4 channels of voltage and 4 channels of current; The range of high-voltage channel can reach ± 2000Vpeak, and the range of current channel can reach 40Apeak; The sampling rate can reach 2MS/s, and the resolution is 24bit. Test accuracy: DC ± 0.02% * reading ± 0.02% * range; AC 0.5~1kHz: ± 0.03% * reading without range error; There is no gap storage, and the signal waveform can be viewed without oscilloscope.
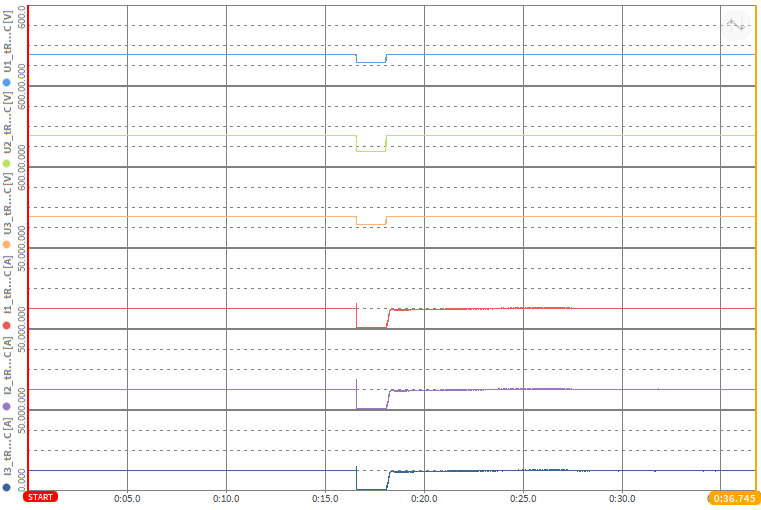
High and low voltage ride through test method of energy storage converter:
Record the voltage drop or rise curve chart and reactive current change chart with waveform chart. Use the cursor to calculate the drop time, power recovery time, etc


