DEWETRON Measuring software for OXYGEN Introduced sound level option
Its version 5.2 will be released at the end of June 2020. The system can automatically calculate time related frequency weighted and time weighted sound pressure levels, energy equivalent sound pressure levels and many other parameters. The input signal of this option is always the analog signal of a microphone, which is a sound sensor in the air. This article describes The OXYGEN sound level option automatically provides the mathematical calculation behind the value, and gives some examples of applications, when to use them. First, let's discuss the term, frequency weighted (also known as A -, B -, C -, D - and Z-weighted) time weighted (i.e. fast, slow, pulse).
Frequency weighting - what is it and why is it needed?
The human ear can detect the deviation of sound pressure in the frequency range of 20 hz~20 khz. Hearing ability declines with age. Before the age of 20, people can recognize the full spectrum from 20 Hz to 20 kHz. Since then, the frequency range has decreased by about 2 khz every 10 years. Of course, these values are only indicators, depending on the individual. It is important to know that human hearing ability depends on frequency. Intermediate frequency is easier to identify than high frequency or low frequency. The following figure shows the corresponding relationship between recognition sound pressure and frequency:
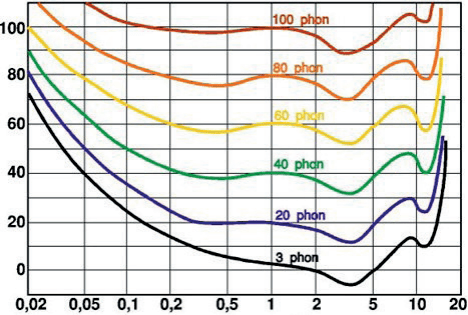
In order to describe the frequency dependence of sound pressure detected by human ear, psychoacoustics introduces the so-called square curve. These curves show sound pressure at the same loudness. Therefore, psychoacoustics introduced unit speakers to increase the volume. 1 khz is the reference frequency. This means that the loudness of "square" always matches the sound pressure level of decibel @ 1kHz. Taking the 60 square curve as an example, the sound pressure level of 60 dB @ 1 kHz is considered to be the 60 square loudness. However, to recognize the loudness of 60 square @ 50 Hz, it requires about 80 dB sound pressure level. 60 decibels or 80 decibels may not sound like a lot, but when changing the non-linear logarithmic decibels to the linear unit Pascal, 60 decibels equals 200 mPa, and 80 decibels equals 20 mPa. Therefore, this is a factor 10 difference!

In sound pressure measurement, in order to respect these frequency related hearing characteristics, frequency weighting curves are used. In the figure below, you can see the weighting curves of A -, B -, C - and D - frequencies.
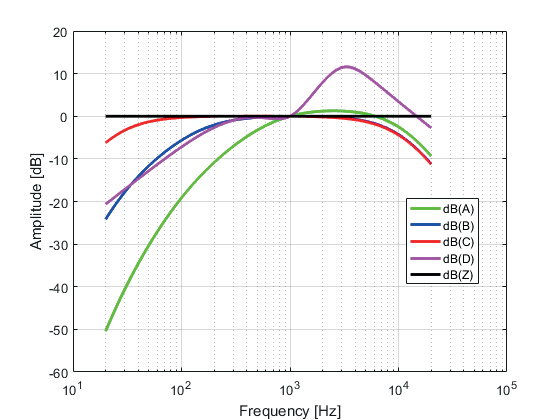
There are four different curves: a - weight, b - weight, c - weight, and d - weight. A weighting theory can be used for low sound pressure level (30 square), b weighting for medium sound pressure level (60 square), and c weighting for high sound pressure level (90 square). In order to weight a very loud sound source such as aircraft noise, the d weighting method is introduced. But in real life, there is almost no exception to the weight of a, because the weight of b and the weight of c almost do not meet the du - ring subject test. The reason is that these curves are created based on tests that use pure (sinusoidal) notes. But pure notes have never appeared in real life. Therefore, in real life, the b - weight method is rarely used, while the c - weight method is rarely used to evaluate the peak sound pressure level. In order to mark the frequency weighting curve used in the measurement, the letters a, B, C add D: dB (A), dB (B), dB (C) or dB (D) to the parentheses of the unit dB. If these curves are not used and the evaluation is linear, it is expressed as 0 in dB (Z).
Time Weighted - What is it and why do you need it?
In the time domain, the determination of sound pressure level consists of root mean square calculation on the one hand to make the result proportional to the energy, and time average calculation on the other hand, which is called time weighting. Time weighting shall indicate different signal characteristics.
According to IEC651 and EN 60651, there are three different time weighting options:
>Fast (rise and fall: 125 ms)
>Slow (rise and fall: 1000 ms)
>Pulse (rise: 35 ms; fall: 1500 ms)
From a mathematical point of view, the time weight can be described by the following block diagram:

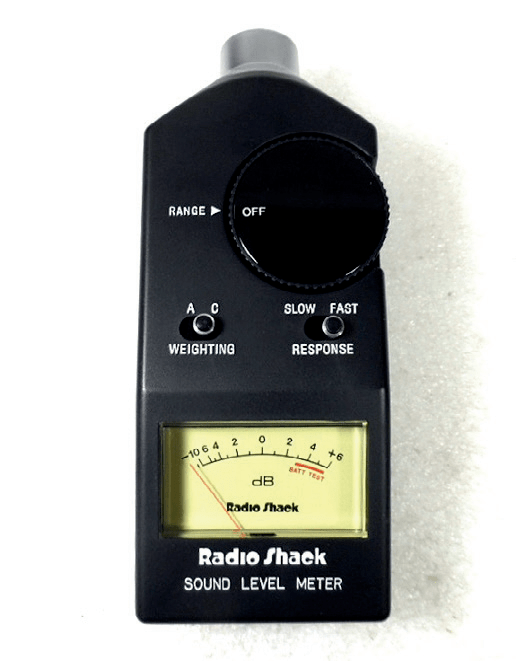
Generally speaking, if the measured value changes quickly, the rise/fall time will be shorter and it is difficult to read the value. On the contrary, the longer the rise/fall time, the slower the measured value changes. So it's easier to read it. For better understanding, consider the previous analog sound level table, as shown in Figure 5. The smaller the time constant is, the faster the pointer moves and the more difficult it is to read the value.
Here are some general suggestions for using time constants:
>Fast (Rise time and fall time: 125 milliseconds): This time evaluation can be selected to consider continuous horizontal changes. This time evaluation is not as easy and reliable to read levels as slow time evaluation because levels change faster. Further processing to equivalent long-term evaluation value is also more complicated here.
>Slow (Rise time and fall time: 1000 ms): Due to the high time constant of 1 second, slow time assessment has the advantage of large fluctuations in smooth level, making reading easier. At the same time, this time evaluation makes it easier to determine the long-term evaluation value of an equivalent.
>Pulse (Rise time: 35 ms; fall time: 1500 ms): If people's short-term perception is to be included in the as evaluation, they can choose time to evaluate impulses. Due to the fast rise time of 35 milliseconds, the pulse sound level is very worthy of consideration. Because of the long fall time of 1.5 seconds, we can use this time constant to display these levels and calculate the long-term level (it should be noted that noise with a duration of less than 1 second is called pulse).
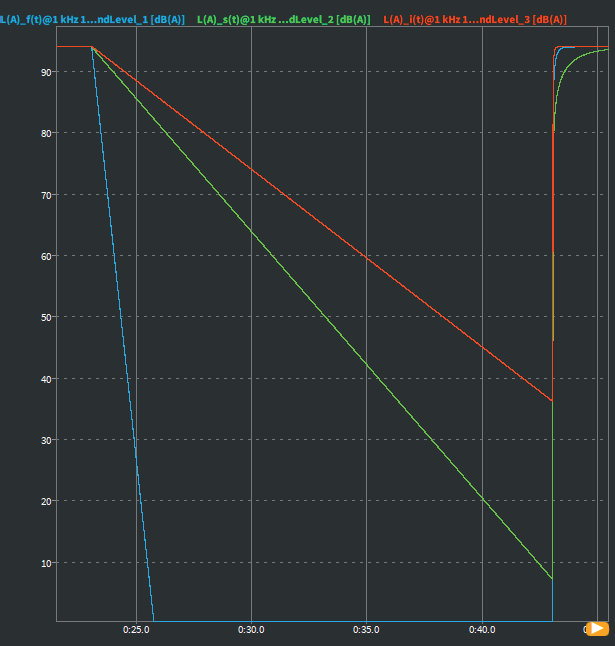
Therefore, the individual's time assessment is in harmony with the opposite characteristics. The time evaluation should be selected according to the criteria that should be paid special attention to in the analysis. The figure below compares the edge of rising and falling signals and the influence of fast (blue), green (red) and pulse (red) weighted signals.
Time dependent sound pressure level
Time related sound pressure levels are frequency and time weighted sound pressure levels in decibels. It reflects the change trend of sound pressure level with time. From a mathematical point of view, according to DIN EN 61672-1, the time related sound pressure level can be determined by the following formula:

The unit of sound data is usually decibels [dB]. The reason why the decibel is used instead of the sound pressure unit Pascal [Pa] is that the dynamic range of the human ear is very wide. The human ear can perceive sound pressure from 20 μ Pa to 200 Pa - a 70 year range. In order to better represent this huge range in the measured values, decibel is selected as the typical unit of sound pressure level. The additional level is always expressed in decibels as the unit of measurement value. The time related sound pressure level can be used to evaluate the change of sound pressure level of rotating machinery during climbing or sliding, and the relationship between sound pressure level and operating speed. It can also be used to assess the trend of sound pressure level for noise monitoring applications, that is, to assess the noise caused by highways adjacent to residential areas. Of course, there are more applications. The generation sound pressure level is also an important parameter in these tests.
Energy equivalent sound pressure level L (A)
The energy equivalent sound pressure level L (A) eq is the correct value, if you want to evaluate the (energy) average sound pressure level in a certain measurement time. According to DIN EN 61672-1, average the sound energy in a certain time interval with the following formula:

The difference from the time related sound pressure level explained in the previous section is that L (A) eq is only an average value in the measurement time, and does not contain time related sound information. In addition, L (A) eq is not time weighted. L (A) eq is usually used to compare noise emissions under different measurement and test conditions. With reference to the above example, L (A) eq can be used here to compare the noise emissions of rotating machines at different operating speeds or loading steps. Another example is to compare the average road noise at different times of the day (i.e. at night or during peak hours). L (A) eq can also be used to determine the sound power level of the machine during post-processing.
Frequency weighted sound pressure
Frequency weighted sound pressure is the original microphone signal filtered by frequency weighted A, B, C or d in Pascal language. It is represented by p (x), and x represents the type of frequency weighting. The signal can be derived as wave current and replayed through sound card to obtain the influence of frequency weighting on the measured signal. In the diagnosis and development of rotating machinery, this signal can also be used for sequence analysis. Ordinarily, order analysis is applied to the sound transmitted by the structure, that is, the signal obtained by the accelerometer or strain gauge sensor. But in many cases, the frequency dependent propagation of vibration in dut structure is not enough. If the dependence of airborne mechanical sound on its operating speed in the frequency domain is to be evaluated, the frequency weighted sound pressure is a signal containing all important information. A The difference between weighted sound pressure and unweighted sound pressure is shown in the figure below. Of course, frequency weighted sound pressure can also be used for any other spectrum analysis, as shown in the figure below.

Daily noise exposure level and noise dose
The daily noise exposure level L (A) Ex, 8h has been introduced into the standard of allowable sound pressure in the specification. In Austria, different noise exposure limits for eight hour workdays and different workplaces are specified in the so-called Verordnung L ä rm und Vibrati on2 (Chinese: Noise and Vibration Regulations). According to the regulation, the daily noise exposure level in the office shall not exceed 60 decibels. If the daily noise exposure limit exceeds 85 decibels, the employer must provide ear protection. Theoretically, the measurement results of L (A) Ex, 8h and L (A) eq within 8h are similar. But in many cases, if the noise level is static and discontinuous, L (A) Ex, 8h can be determined for shorter noise measurement. In this case, L (A) eq measured in less than 8 hours can be extrapolated to an exposure time of 8 hours, using the following formula:

In OXYGEN, L (A) Ex, 8h shall be measured according to the above formula. Sometimes, it is necessary to determine L (A) Ex, 8h, and the reference time of the whole working week is 40 hours instead of 8 hours. This equation cannot be directly implemented in OXYGEN, but can be easily deduced by using OXYGEN mathematical options and the above formula. The noise dose D gives an indication of what percentage of your exposure limit has been reached with the following formula:

The exposure limit for noise dose is specified as 85 dB. If it is necessary to use noise dose to evaluate other exposure limits, the above formula can also be easily realized by using OXYGEN mathematical formula. The following table gives an overview of L (A) Ex, 8h, and the noise dose and measurement time of L (A) eq:
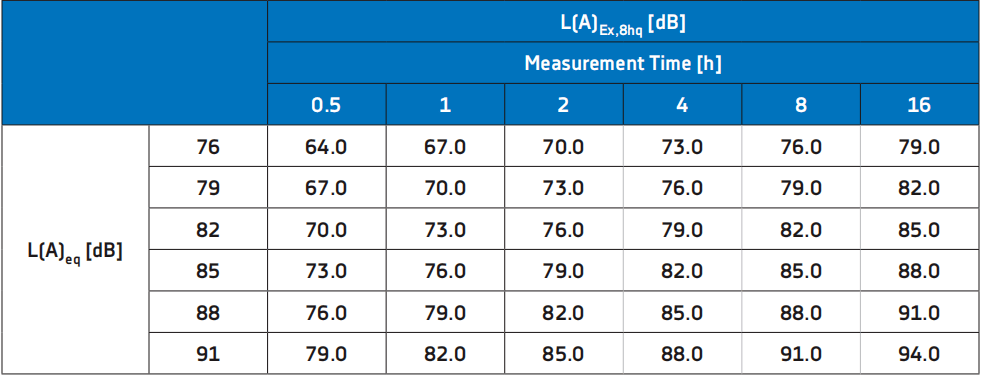
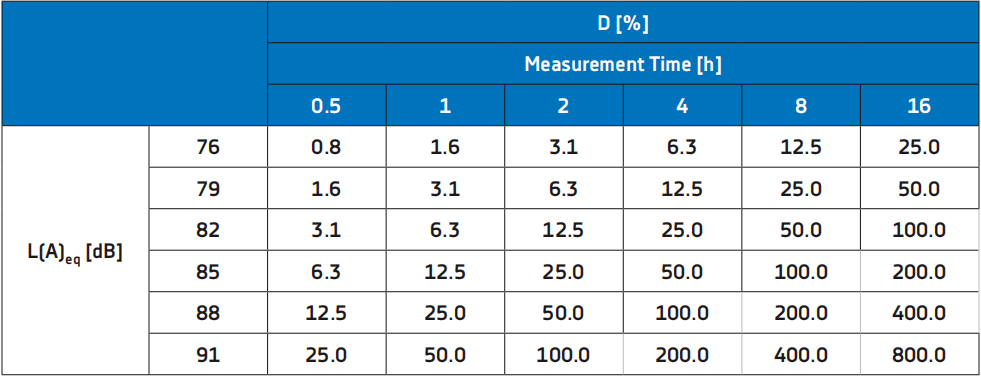
Here, you can clearly see the following correlations:
>When L (A) eq is measured for 8h, L (A) Ex is equal to L (A) Ex. When L (A) eq remains unchanged for 8h, doubling the measurement time causes L (A) Ex to increase by 3 dB, 8h
>L (A) Ex, increase 3db after 8h, double the noise dose, and vice versa; L (A) Ex, decrease 3db after 8h, halve the noise dose
Percentile sound pressure level
The OXYGEN Sound Level option can be used to perform a statistical sound pressure level analysis to obtain an indication of which sound pressure level is exceeded by a certain percentage threshold of the measurement time. Especially in long time measurement, this is usually used to derive common parameters. The percentage threshold can be OXYGEN Free definition in.
The following example will show you how to use this calculation:
In indoor acoustics, in order to understand the sound pressure level during the activity, the sound pressure level of rooms and halls is usually recorded in places crowded with audiences. At the same time, it is also interesting to know the background noise level of the empty room or the speaker's speech effort in front of the audience to obtain different speech intelligibility parameters.
Of course, these parameters can be determined by a second measurement, but they can also be determined by the sound pressure level monitored in the event.
Why statistical sound pressure level analysis is needed:
In room acoustics, L (A) 95.0 is generally considered as the background noise level of an empty room, which is the sound pressure level exceeded in 95% of the measurement time. L (A) 33.3 is the sound pressure level exceeded in 33.3% of the measurement time, which is generally considered as the speaker's speaking effort. Other percentage thresholds representing other sound pressure levels also exist, which can be freely defined and automatically calculated by OXYGEN.
summary
This article introduces the calculation method behind the values obtained by the OXYGEN sound level option, and provides application examples commonly used by these values. The terms frequency weighting and time weighting are discussed in detail.
Of course, there are more applications, and the content is not over yet. Please feel free to contact us if you have specific questions about the feedback on the functions and additional features of the sound level option. We are happy to receive any feedback you may share with us!


