along with DEWETRON The data acquisition software of OXYGEN is updated to OXYGEN 6.7. This intuitive measurement software introduces several new functions and improvements. The new enhancements focus on power analysis, timing analysis and the new energy manager of the DEWE3 system. In addition, new SCPI commands and many other useful improvements are provided.
In the following article, we will introduce you to several new features and provide an overview.
Timing analysis improvement
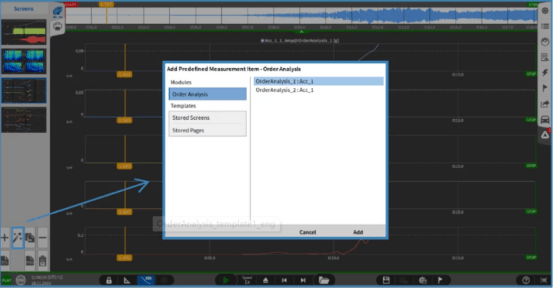
OXYGEN 6.7 further introduces two major improvements on time series analysis tools. First, after performing timing analysis, OXYGEN now automatically creates a screen template. However, to view the screen template, you must add it to the screen. Therefore, just click the "Add predefined item" symbol in the lower left corner of the screen, select the template, and click "Add".

Figure: Add interface template.
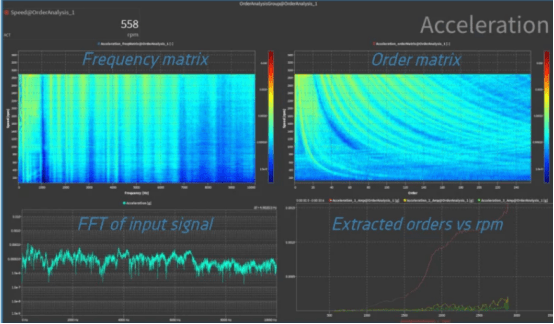
Typically, the added template shows four figures. This includes frequency matrix (upper left), order matrix (upper right), FFT of input signal (lower left) and extracted order relative RPM (lower right).

Figure: Interface template of time series analysis.
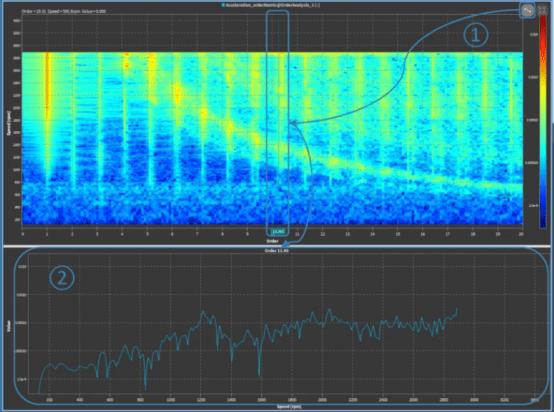
Secondly, we have implemented a cursor (see ① in Figure 4), which allows users to extract the order from the intensity graph. Therefore, first select the cursor, and then click the desired order in the intensity diagram. This will display the selection order based on RPM and strength.

Figure: Time series analysis intensity diagram. ① Cursor for extracting timing. ② The relationship between rotation speed and extraction timing intensity.
Improvement of chart recorder
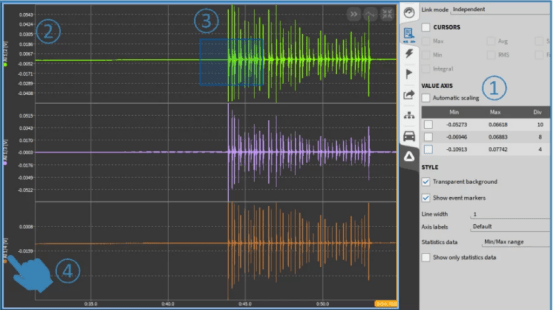
In order to improve the availability of chart recorder, we have implemented four small and beneficial functions:
Automatic y-axis scaling (①)
Improved Y-TickLabels (②)
Chart box zoom option (③)
Automatic y-axis zoom (④)

Figure: Chart recorder improvements.


